Camel Studio
The Camel Studio provides a complete experience with everything you need to design and deploy your integrations. We'll discuss each part of the Studio along with the features available for you.
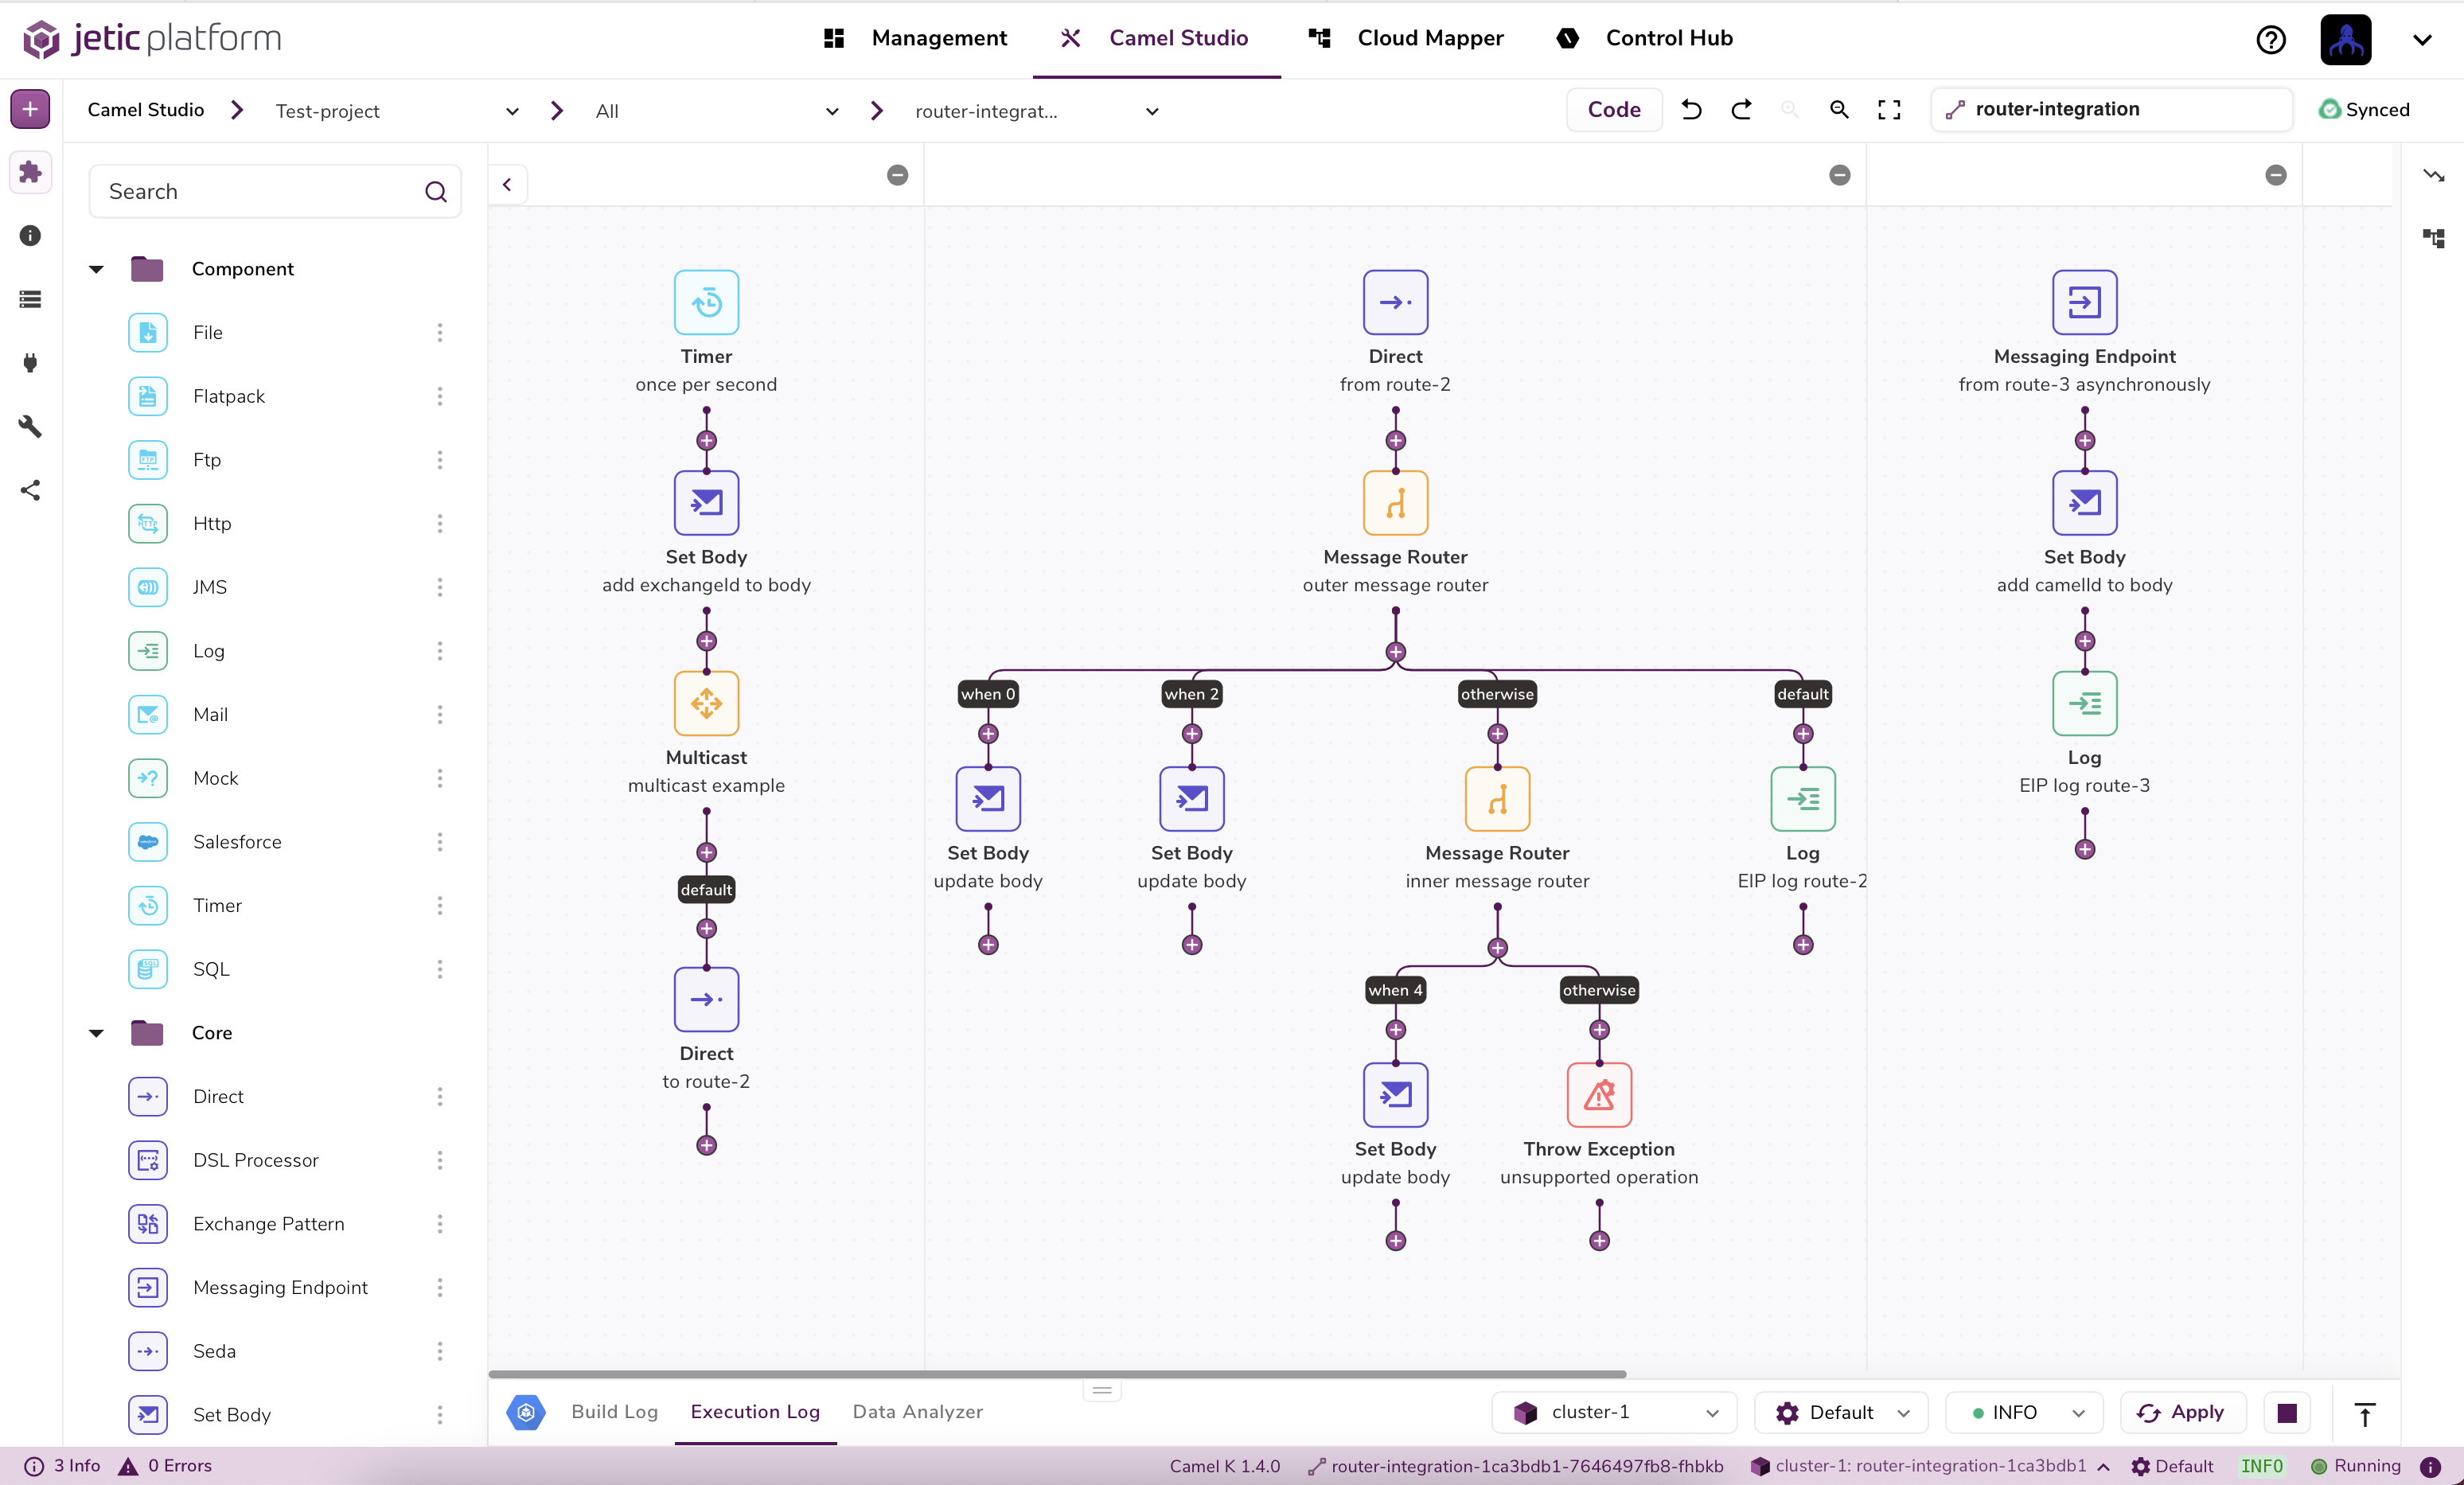
When you first navigate to the studio it will be mostly empty until you select an integration in the navigation breadcrumbs.
-20887fa2e2a068af761ba8d61b0d1550.png)
If you don't yet have an integration to select you can always create one with the '+' button in the top left.
The Catalog#
We provide a drag-and-drop component catalog equipped with almost every component offered by Camel. These are the components that you'll use to build your integrations and there are hundreds. With these components you should be able to connect to virtually every data source you may need.
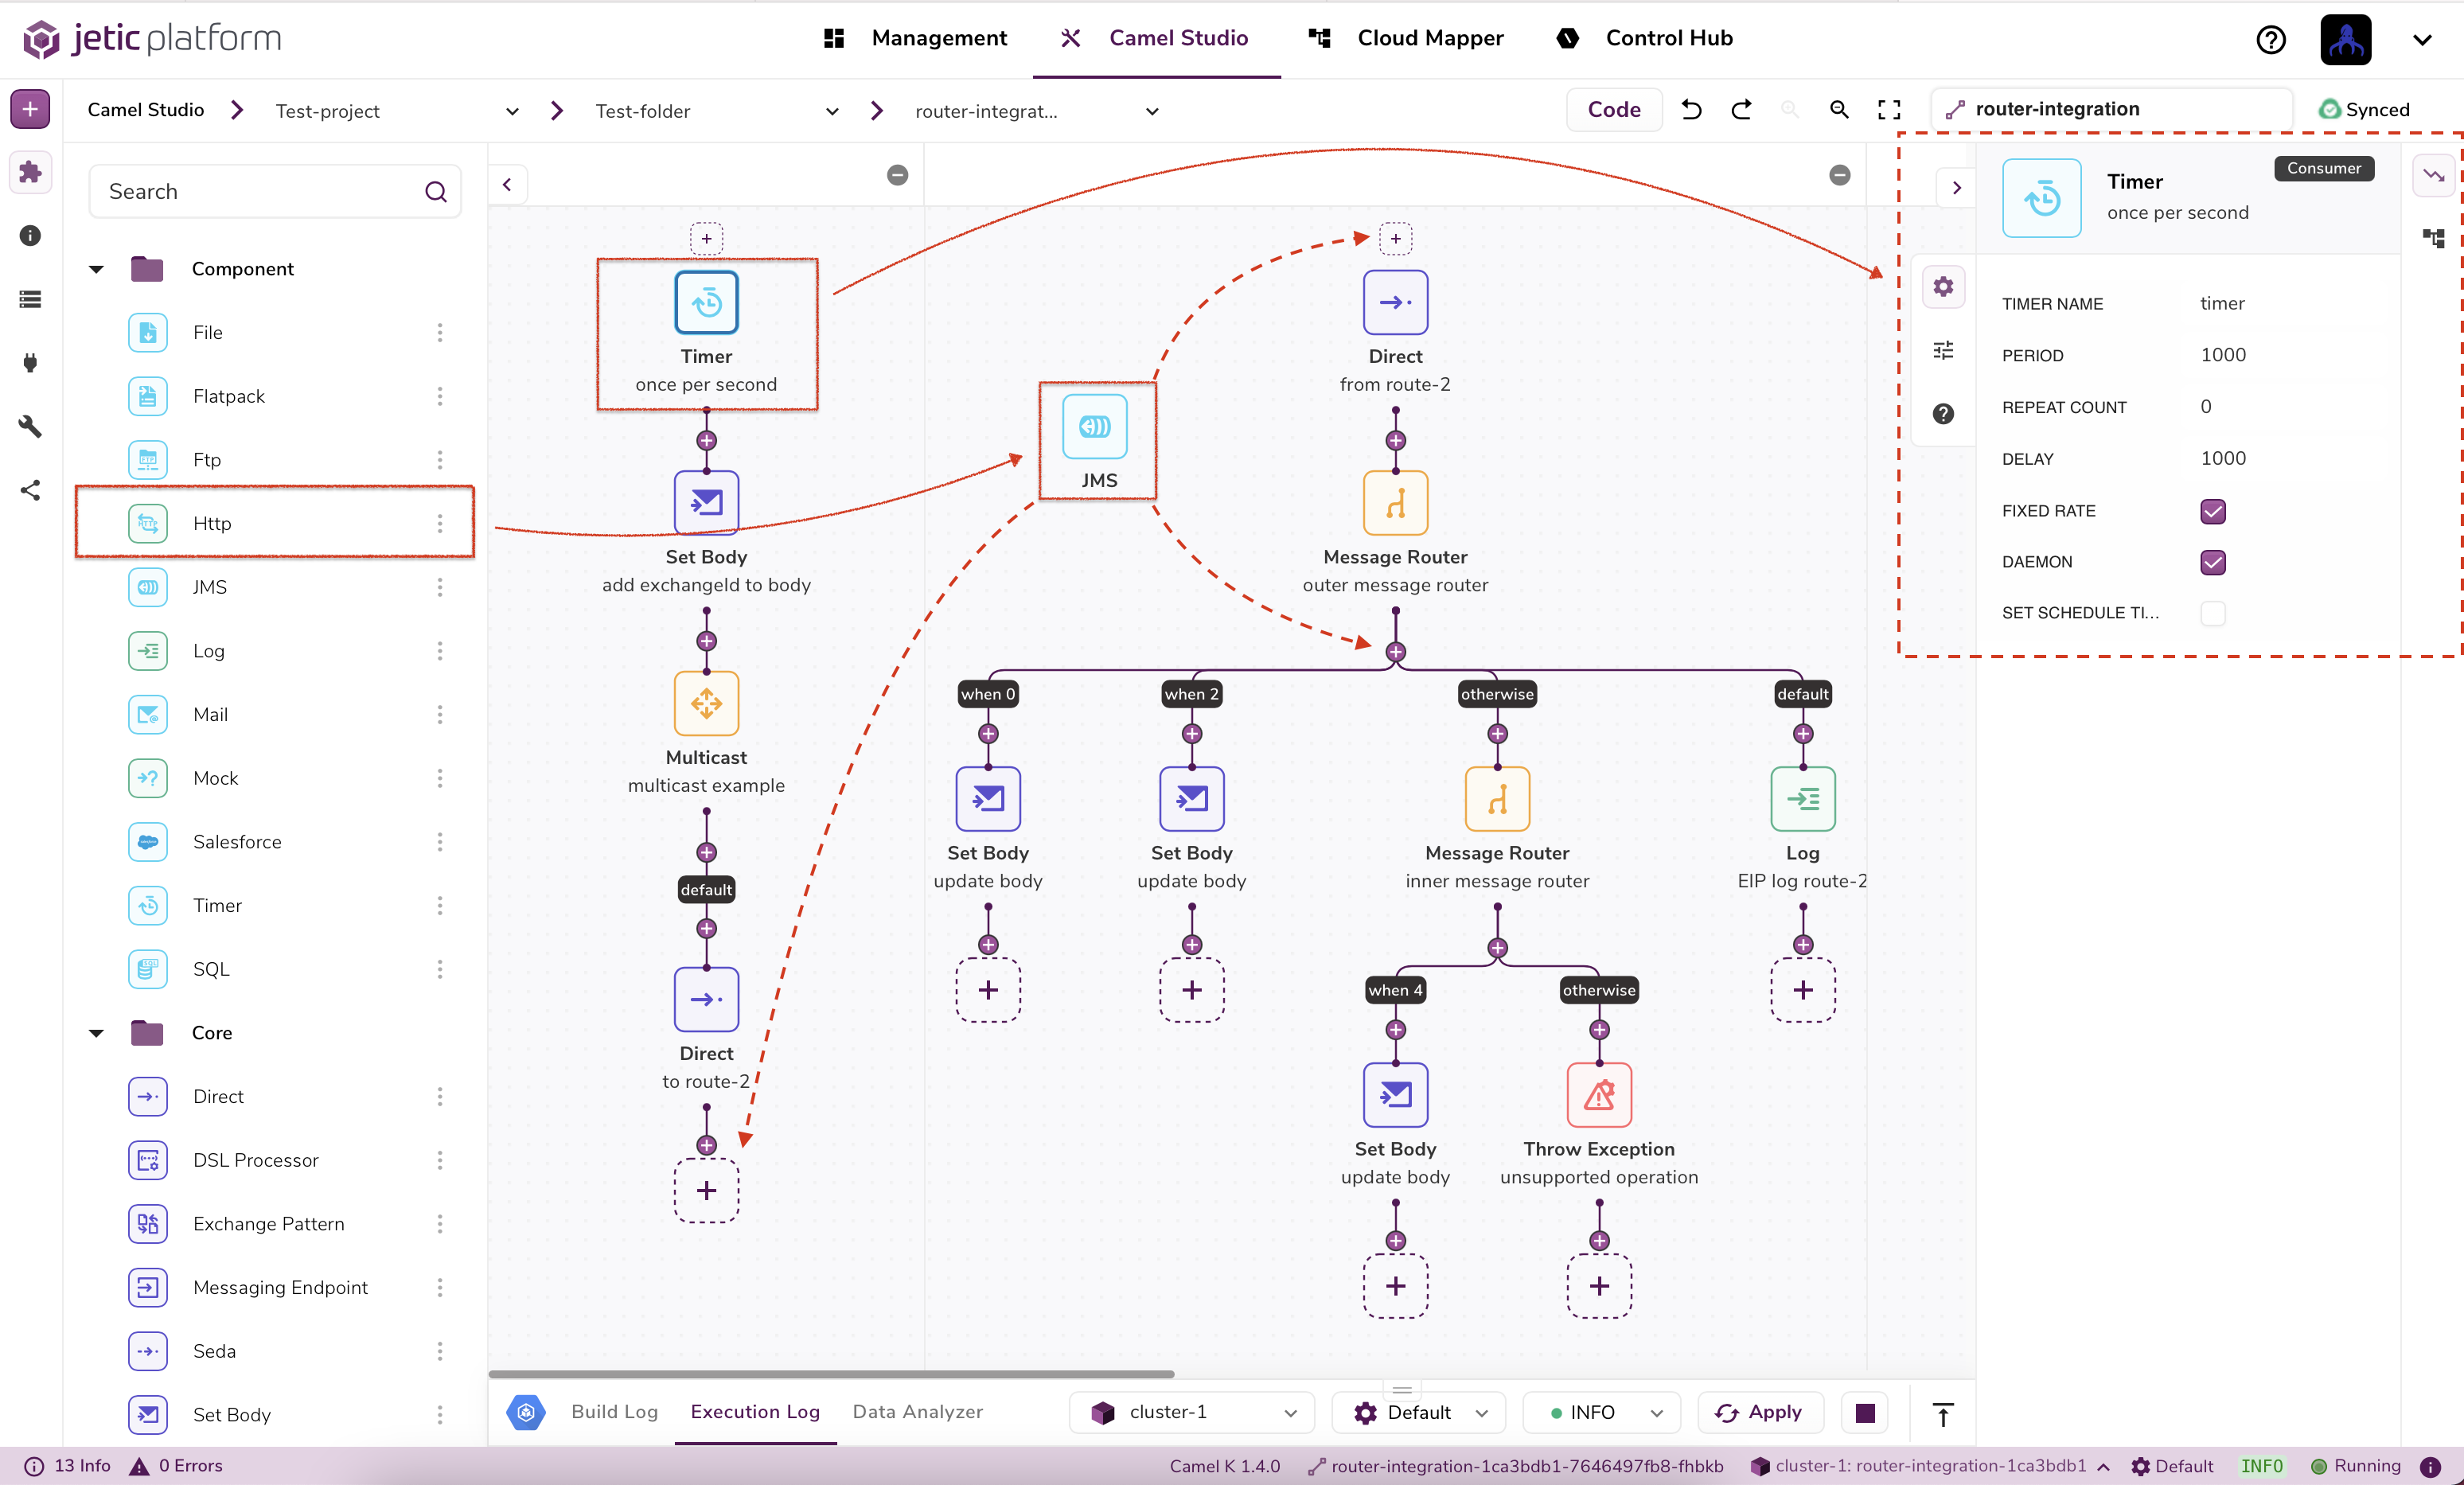
Drag and Drop#
Each component in the catalog can be dragged & dropped into the studo. There are indicators that show valid locations to drop a component. These are denoted by squared and circles with '+' icons.
tip
You can also add components to the studio by clicking on any available '+' icon. This will open a small modal window where you can search for components directly in the studio
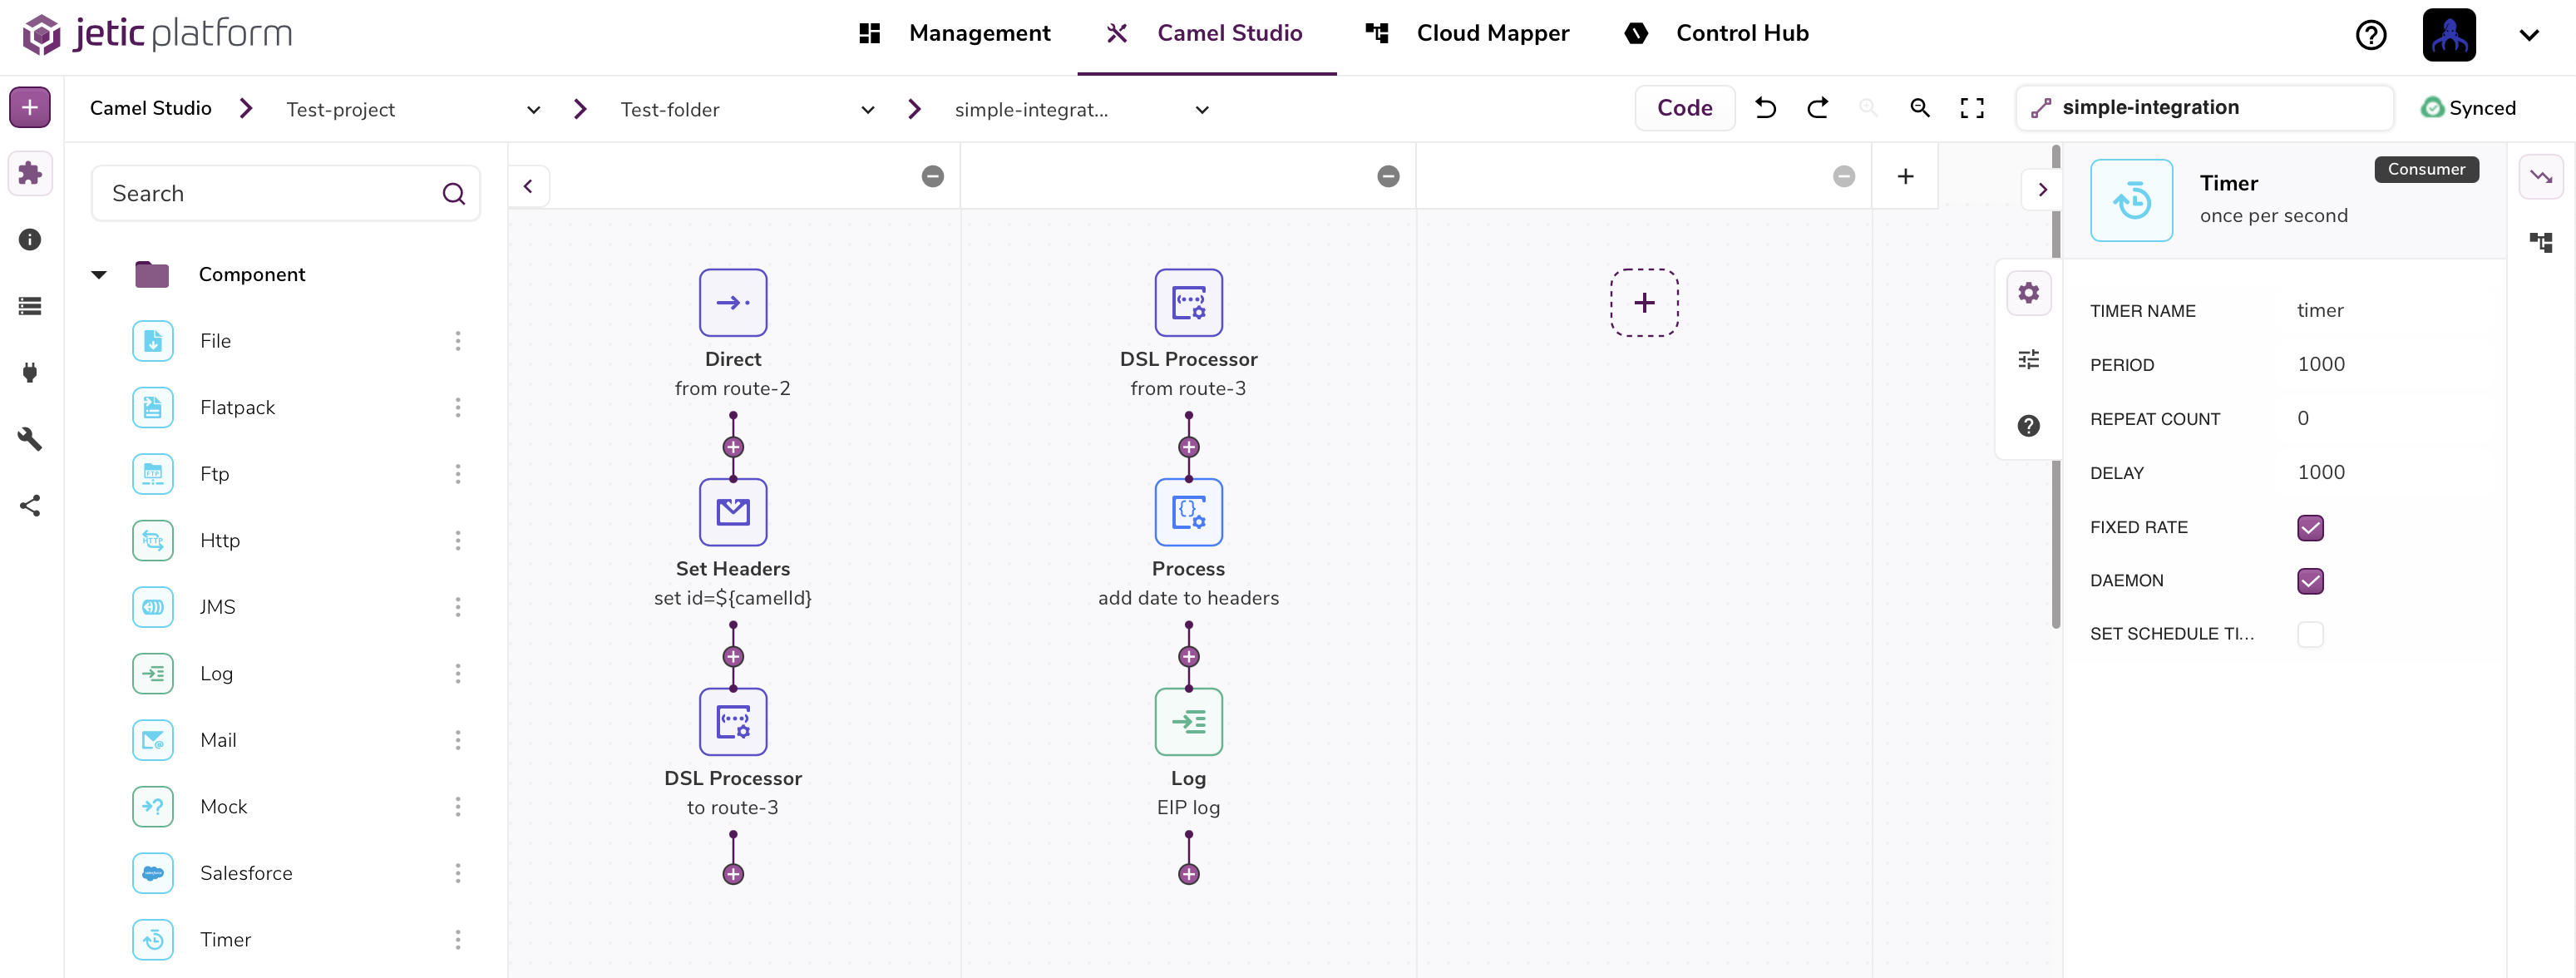
Component Configuration#
To configure a components parameters you must first highlight the component by selecting it. Once highlighted simply click the config icon in the side panel on the right hand side of the studio. The configuration opens with the 'General' parameters tab open by default.
tip
You can also double click a component to open the component configuration panel
At the top of the panel you'll see the icon of the highlighted component and in the top right the type, e.g. Consumer, Producer, Router, etc.
Underneath the component name there is a box available for a description of the component. The description you add will appear underneath your component in the studio.
Below are the different tabs available in the configuration panel.
General Parameters These are typically the most common and useful parameters that available for configuring a component.
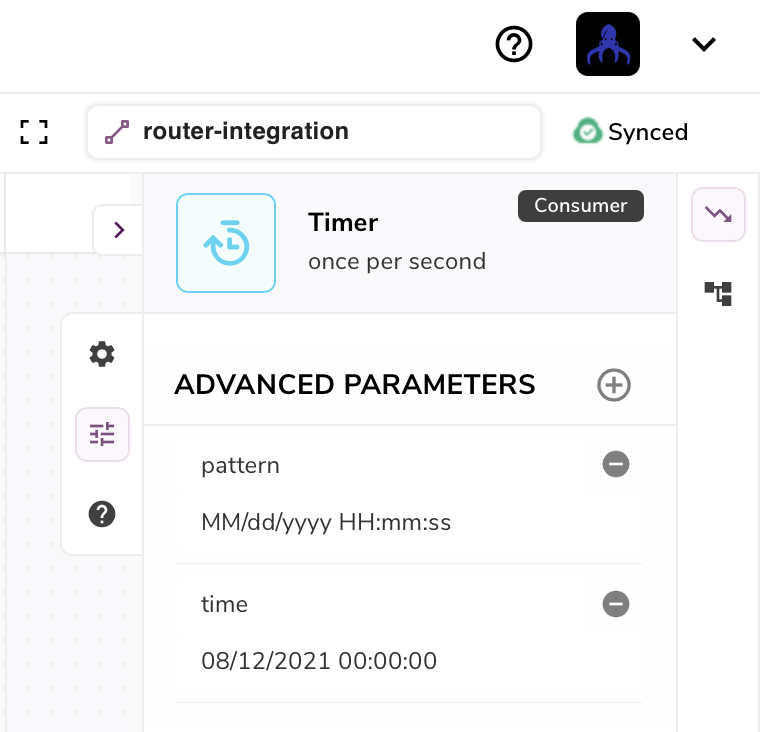
Advanced Parameters Here you can set any parameter for a given component. You may even override parameters set in the 'General' tab. For a full list of a components and their configurable parameters, check out the Camel Component documentation or in the 'Documentation' tab below 'Advanced Parameters'.
note
In the Camel Component documentation the 'parameters' we refer to will be called 'options'.
- Component Documentation Each components documenation is available in this tab. You'll find a description for a component and all available configurations.
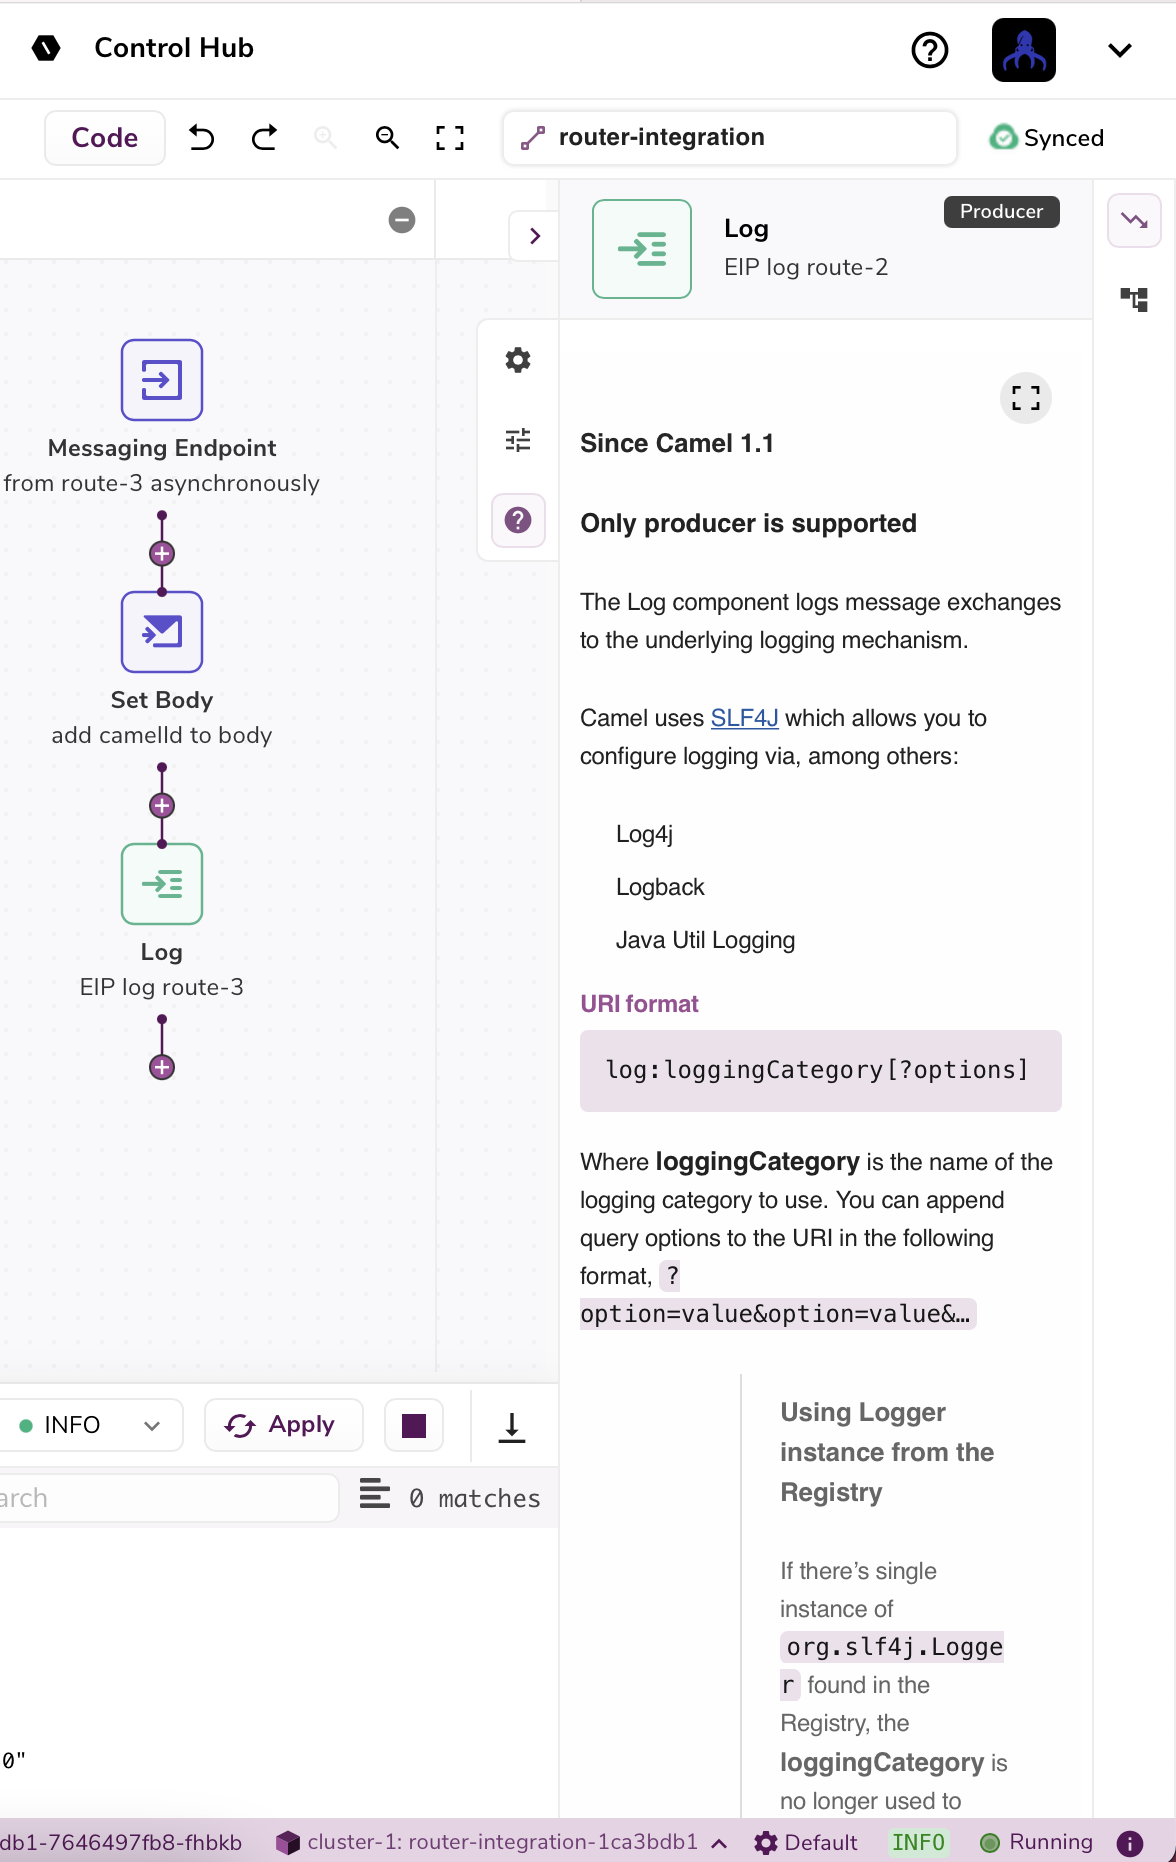
tip
The documentation is easier to read if you click the expand button in the top right of the documentation tab
Code Generation#
You can view the equivalent Camel DSL code for your integration by clicking the 'code' button towards the top right of the studio. This is the code that will be used by Camel K to deploy your integration as a microservice in your Kubernetes cluster.
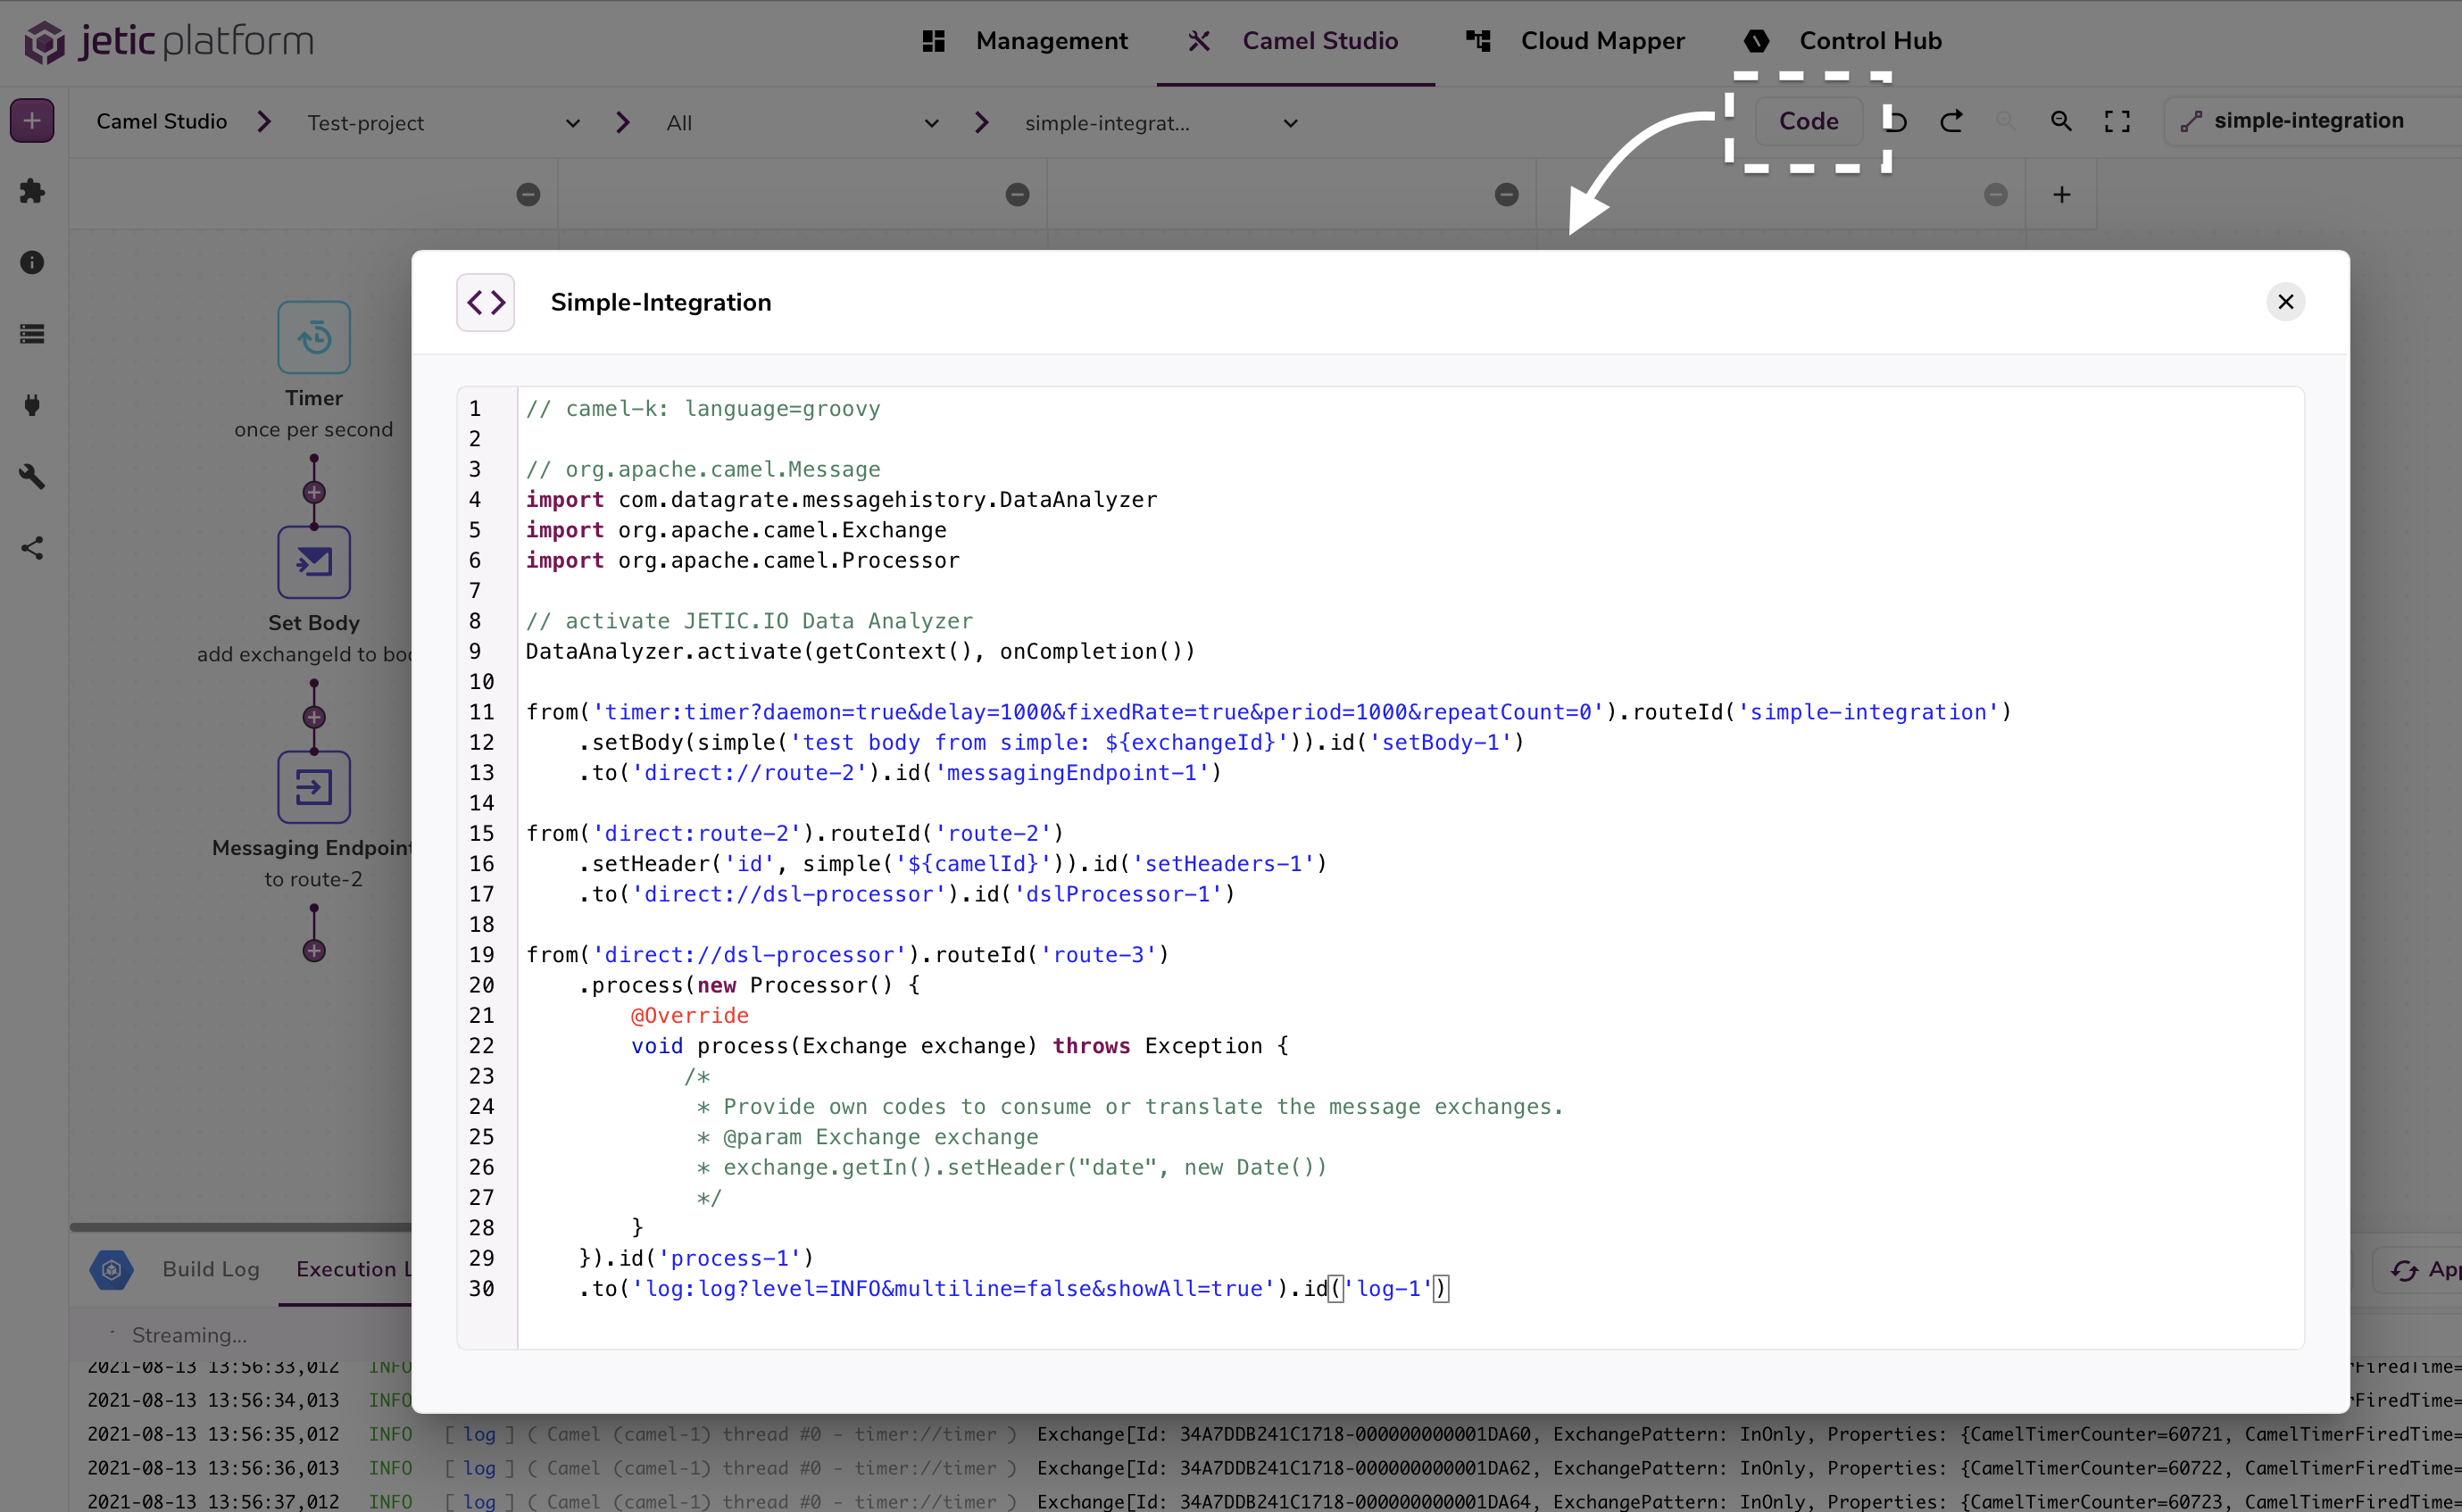
note
The code button will save the current state of your integration before generating and displaying any code. If you have any unsaved progress it will be saved before displaying code.
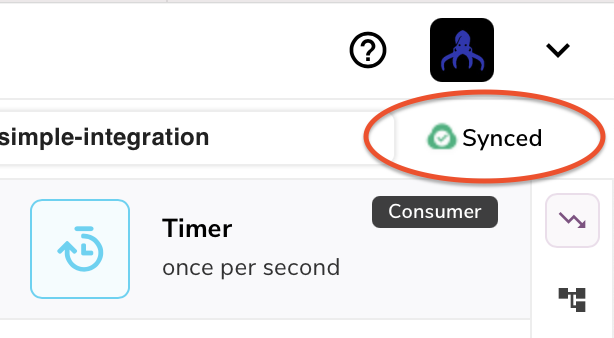
Auto Saving#
The Camel Studio will automatically save your integration progress every few moments. This is set by default for your convenience and cannot currently be deactivated.
You can view when autosaving is taking place by 'synced' button in top right of the Studio
"Swim Lanes"#
Integrations are split into columns, called Swim Lanes. Each swim lane corresponds to a route in your integration and should have a unique routeID. An auto incrementing routeID is provided by default but can be overriden by selecting the text box at the top of every Swim Lane.
To add a new route to your integration simply add to the empty rightmost Swim Lane that is always available. You may have to scroll to view it.
To remove a Swim Lane simply click on the '-' in the top right of a Swim Lane
note
You cannot remove the rightmost Swim Lane. It is always available and will simply be ignored if empty during deployment.
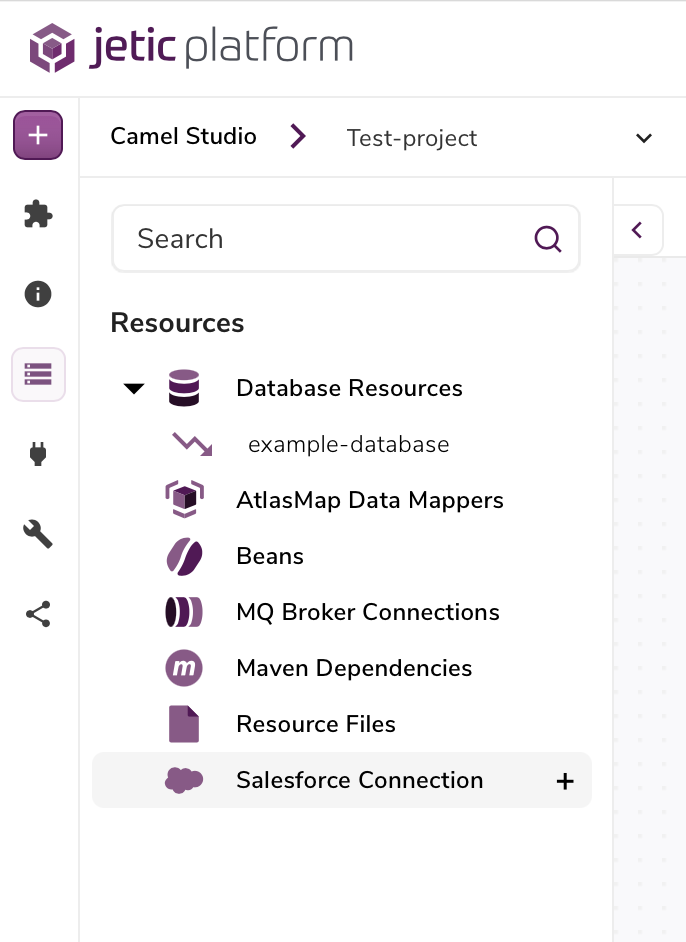
Resource Management#
There are additional resources you can link to your integrations such as custom Beans, Maven dependecies, Database connections, etc. These resources are managed in the 'Resource' section of the side bar on the left hand side of the studio.
You can create, update, and delete all sorts of resources that can be used in your integrations. We're continually updating our application so more resources are likely to come soon!
Once you create an integration it is ready for reference in your integration although you don't necessarily need to use it.
As an example, if you'd like to connect to a database in your route you can create a Database resource:
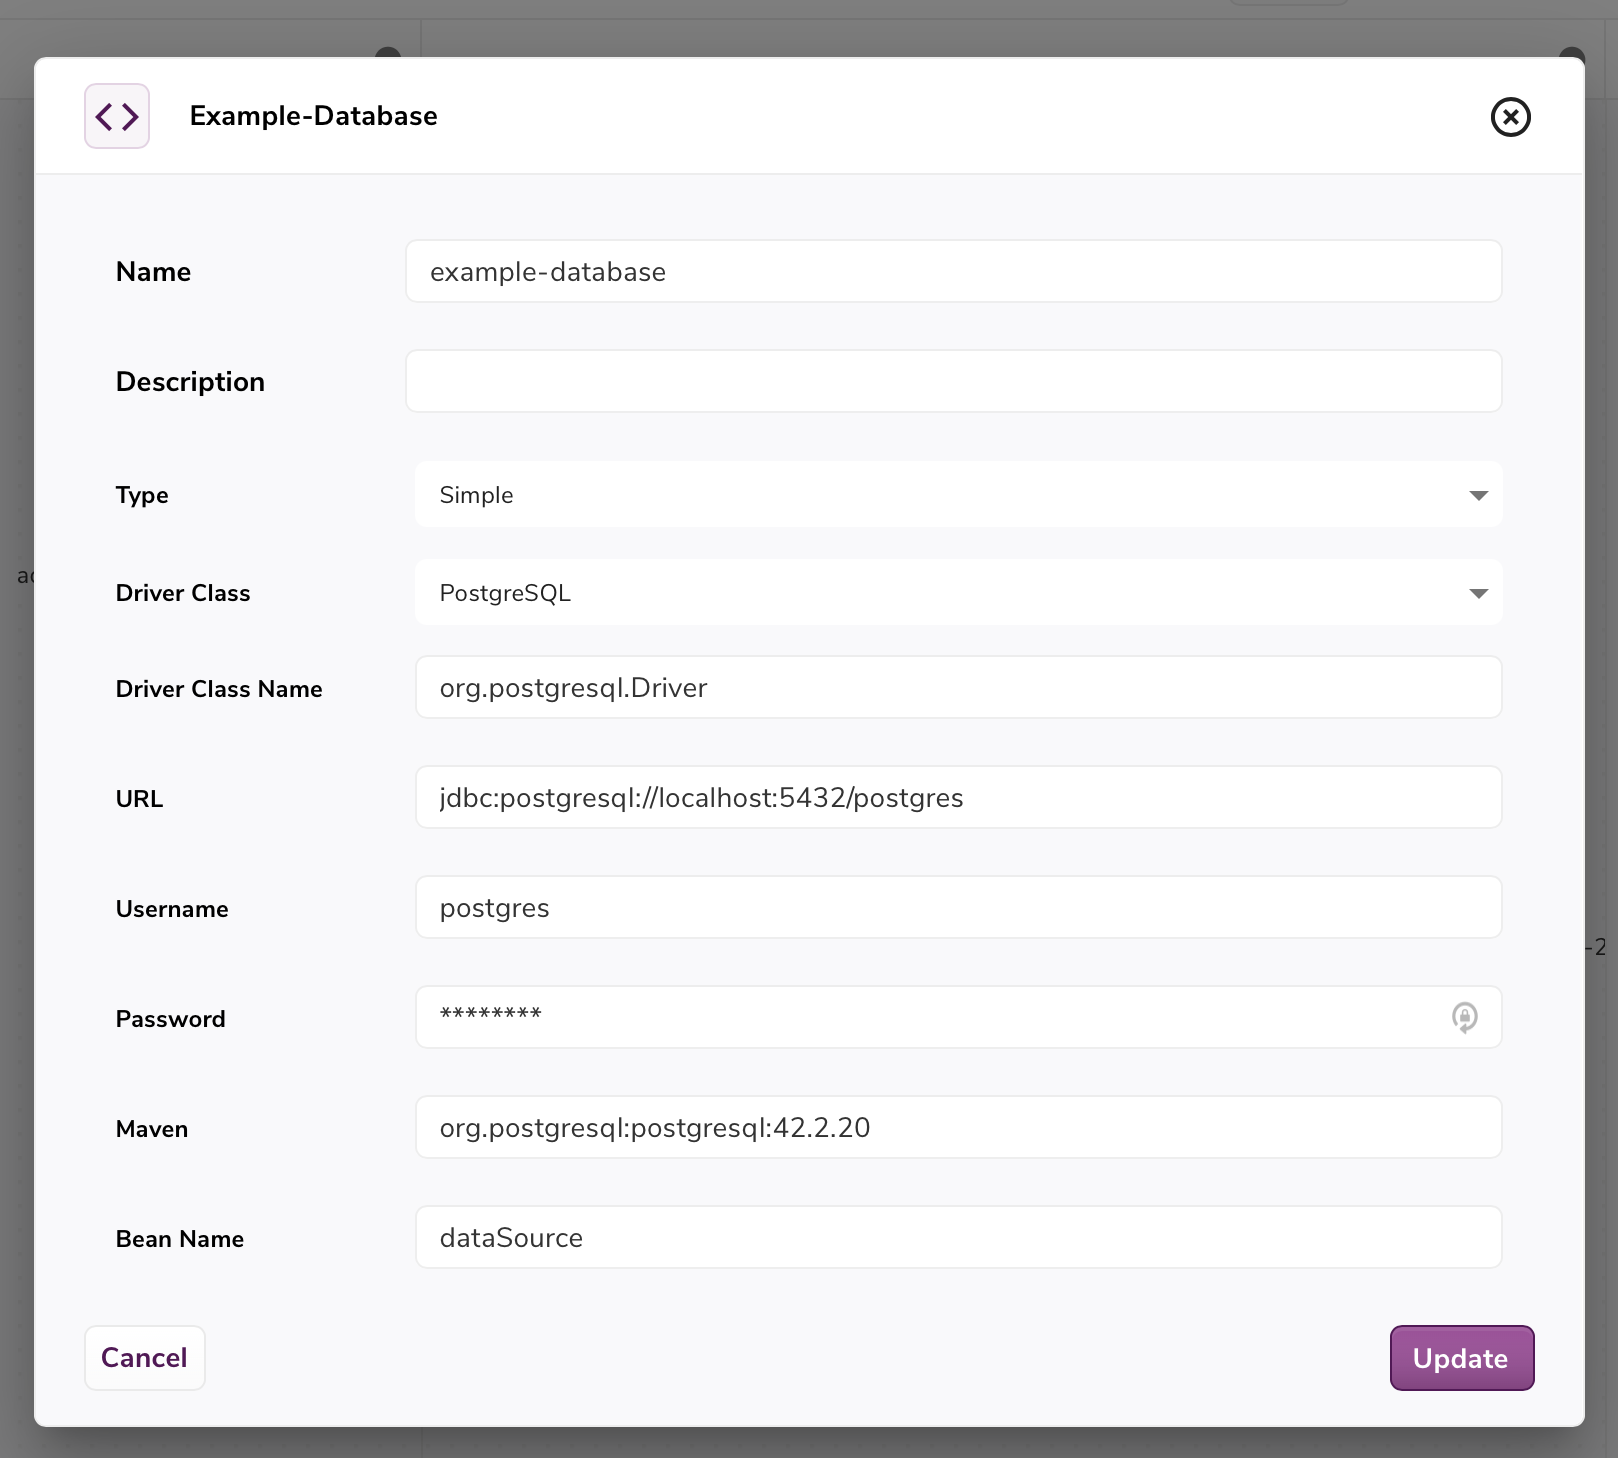
Take note of the 'Bean Name' you provide your resource. This will be the name of your underlying Bean class that will be generated behind the scenes. Next configure a SQL component in your integration and for the 'Data Source Bean Name' use the name of your resources 'Bean Name'. Now your SQL component is configured with your connection to your database!
important
These resources exist on a per-integration basis. So for every integration you create they will each have their unique resources. There is currently no way to share resources across multiple integrations.
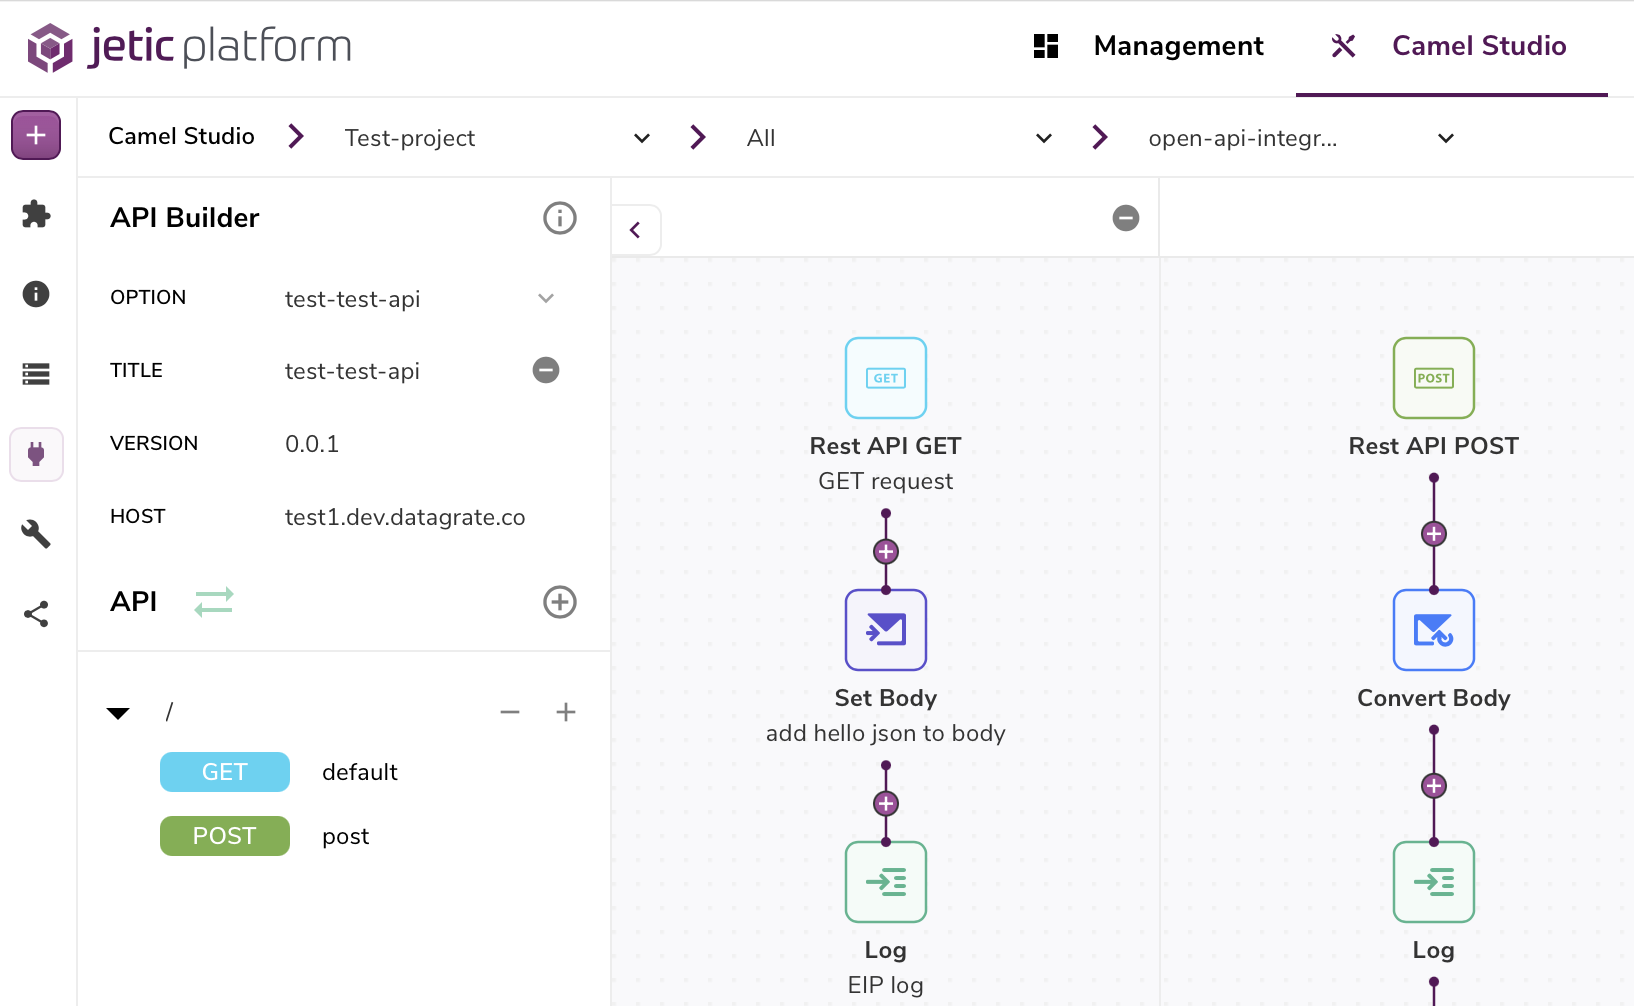
API Builder#
The studio API builder is used for integrating OpenApi specifications into your integration. The API Builder is available in the sidebar in the left hand side of the studio.
important
The API Builder actually has it's own documentation available here if you'd like more information!
You can create new specifications with our intuitive UI or even import your own! Once created or imported you can expose your OpenAPI by dragging your new Endpoint components directly into the studio.
Git Integration#
Coming soon!
Parameters Management#
Setting parameters can be very useful your integrations, especially if you want to parameterize for different environments.
Parameters can be managed in the 'Parameters' section of the side bar on the left hand side of the studio and are organized by 'Profiles'. Each Profile will have their own set of unique cluster parameters.
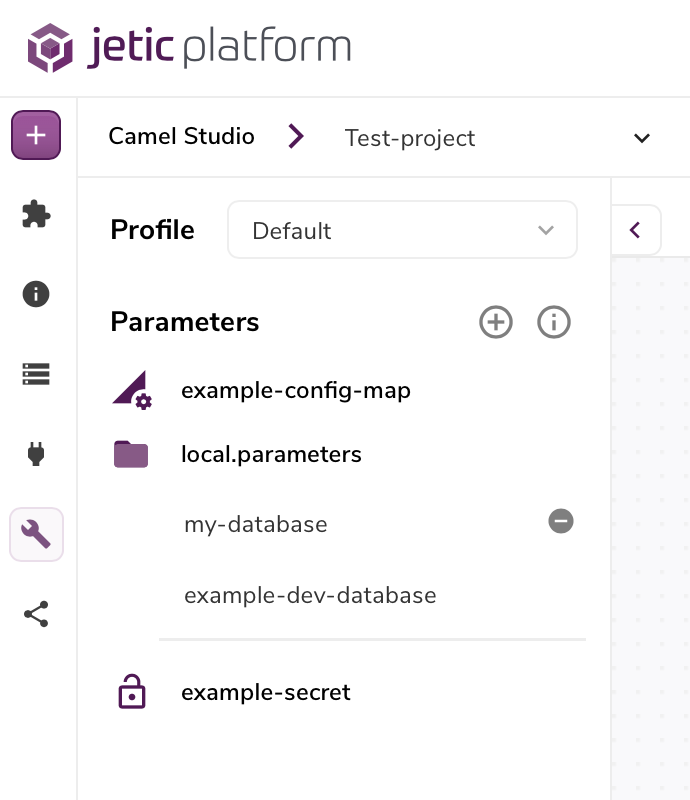
You can create and reference all kinds of cluster parameters in your integrations in a similar way to Resources. Simply create a new cluster parameter type and reference them by ID/name in your integrations.
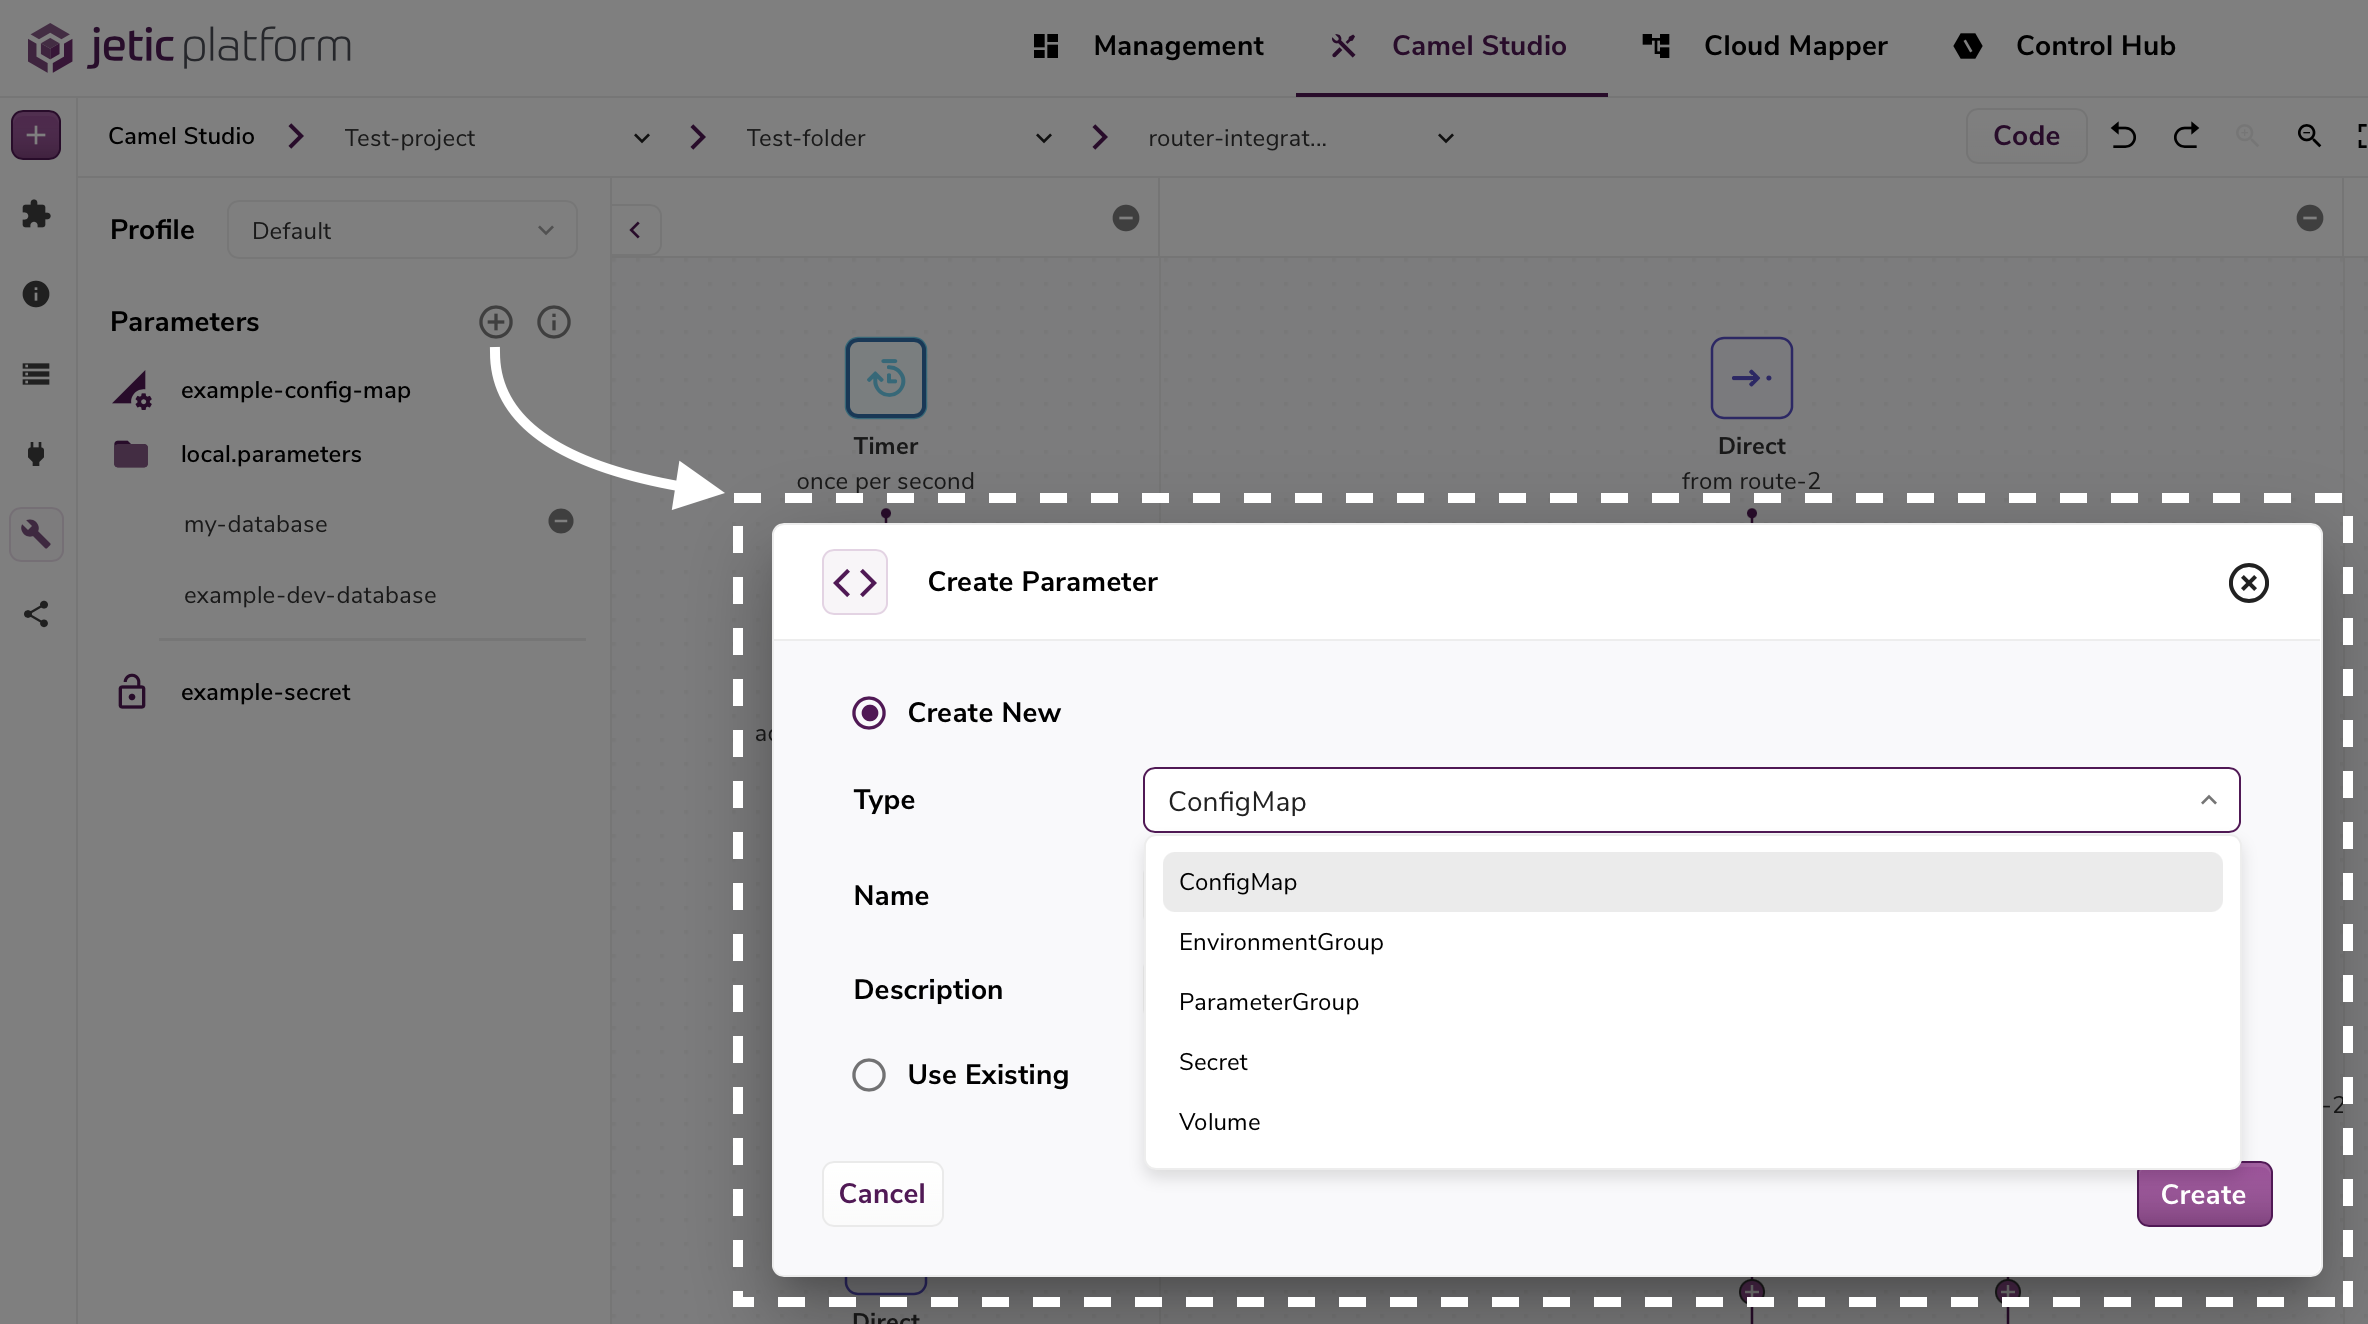
For example you can create a new Secret parameter which corresponds to an existing Kubernetes Secret in your cluster. Once you reference the Secret parameter in your integration, when deployed it will fetch your existing Kubernetes Secret.
You can do the same with most other parameters like config maps, volumes, etc. As we continually update the application there may be more parameters offered in later releases.
Coming soon!#
Brief descriptions of the following parameters:
- Secret
- Config Map
- ParameterGroup
- EnvironmentGroup
Trait Management#
With our Trait managment in the side bar you can configure a comprehensive list of all kinds of traits offered by Camel-K. Use this to manage and fine-tune how Camel-K deploys your integrations.
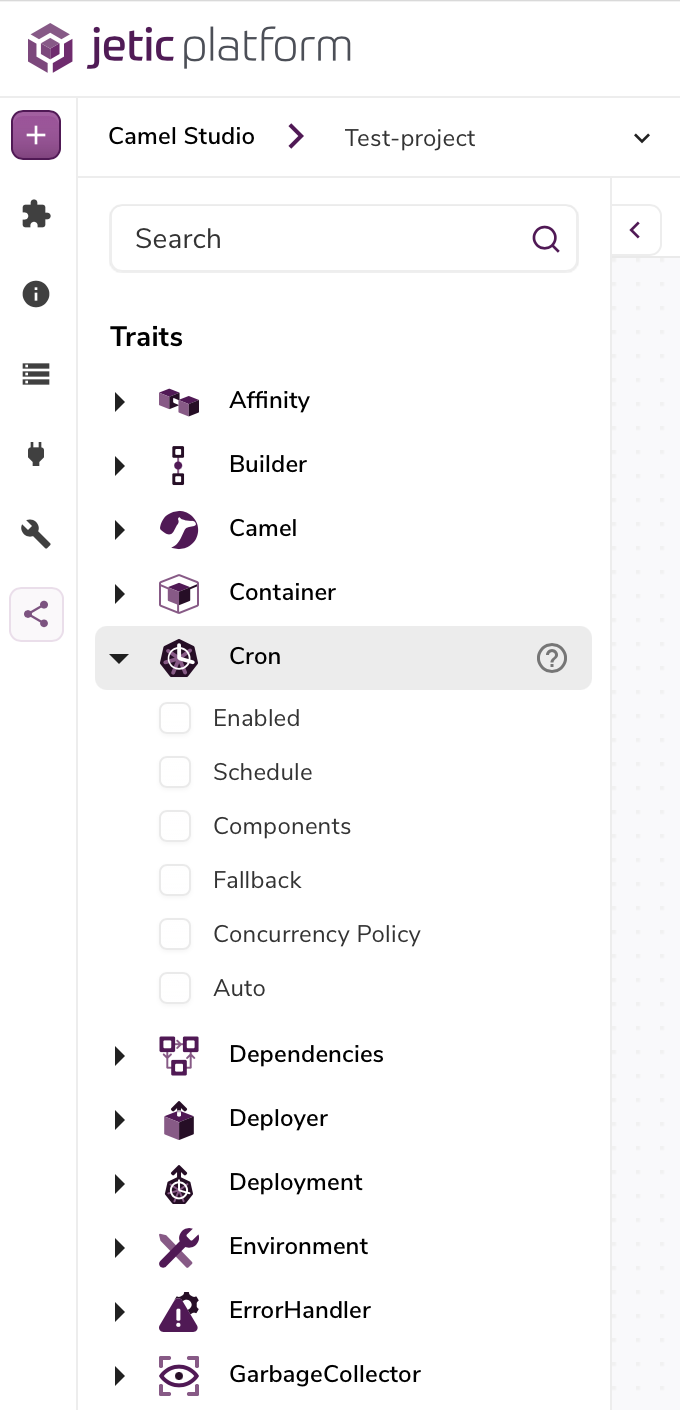
You'll notice that Traits are grouped by their type and a description of each trait is available by clicking the '?' icon to the right of any Trait.
tip
Individual trait values also provide descriptions with a simple hover of the mouse
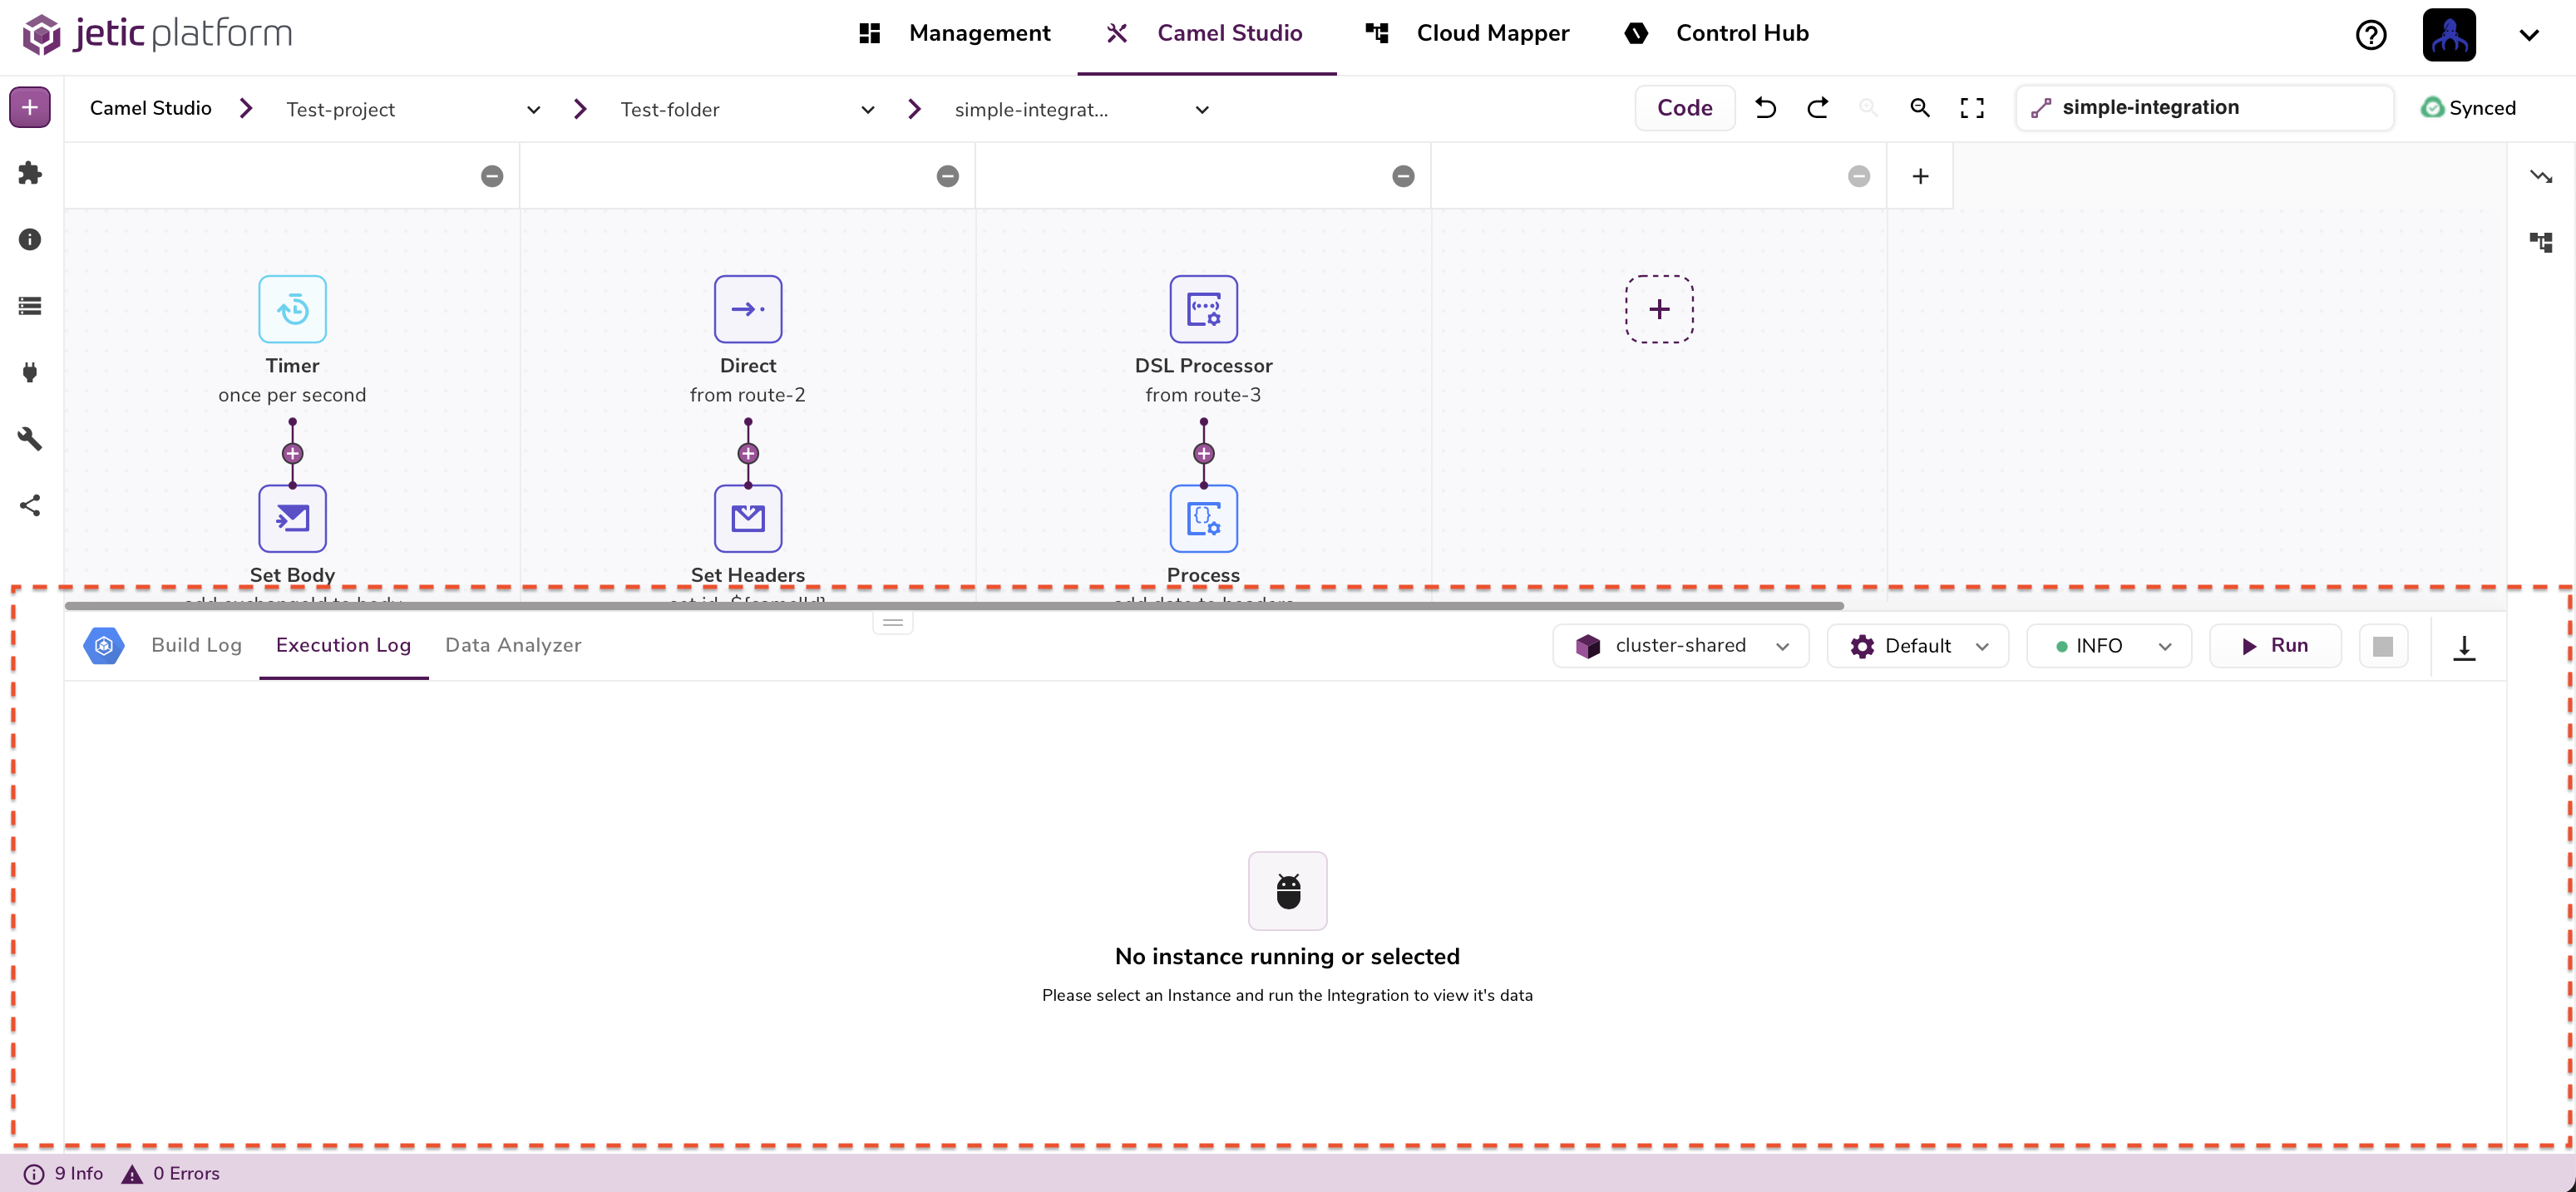
Deployment Manager#
When deploying your integrations to your cluster you can use our Deployment Manager which lets you visualize virtually every step of the deployment process. The Deployment Manager is located in the lowermost portion of the Studio. It might be collapsed so you may have to click and drag it up.
tip
You can use the arrow icon on the right side of the bar to expand and collapse the Deployment Manager as well
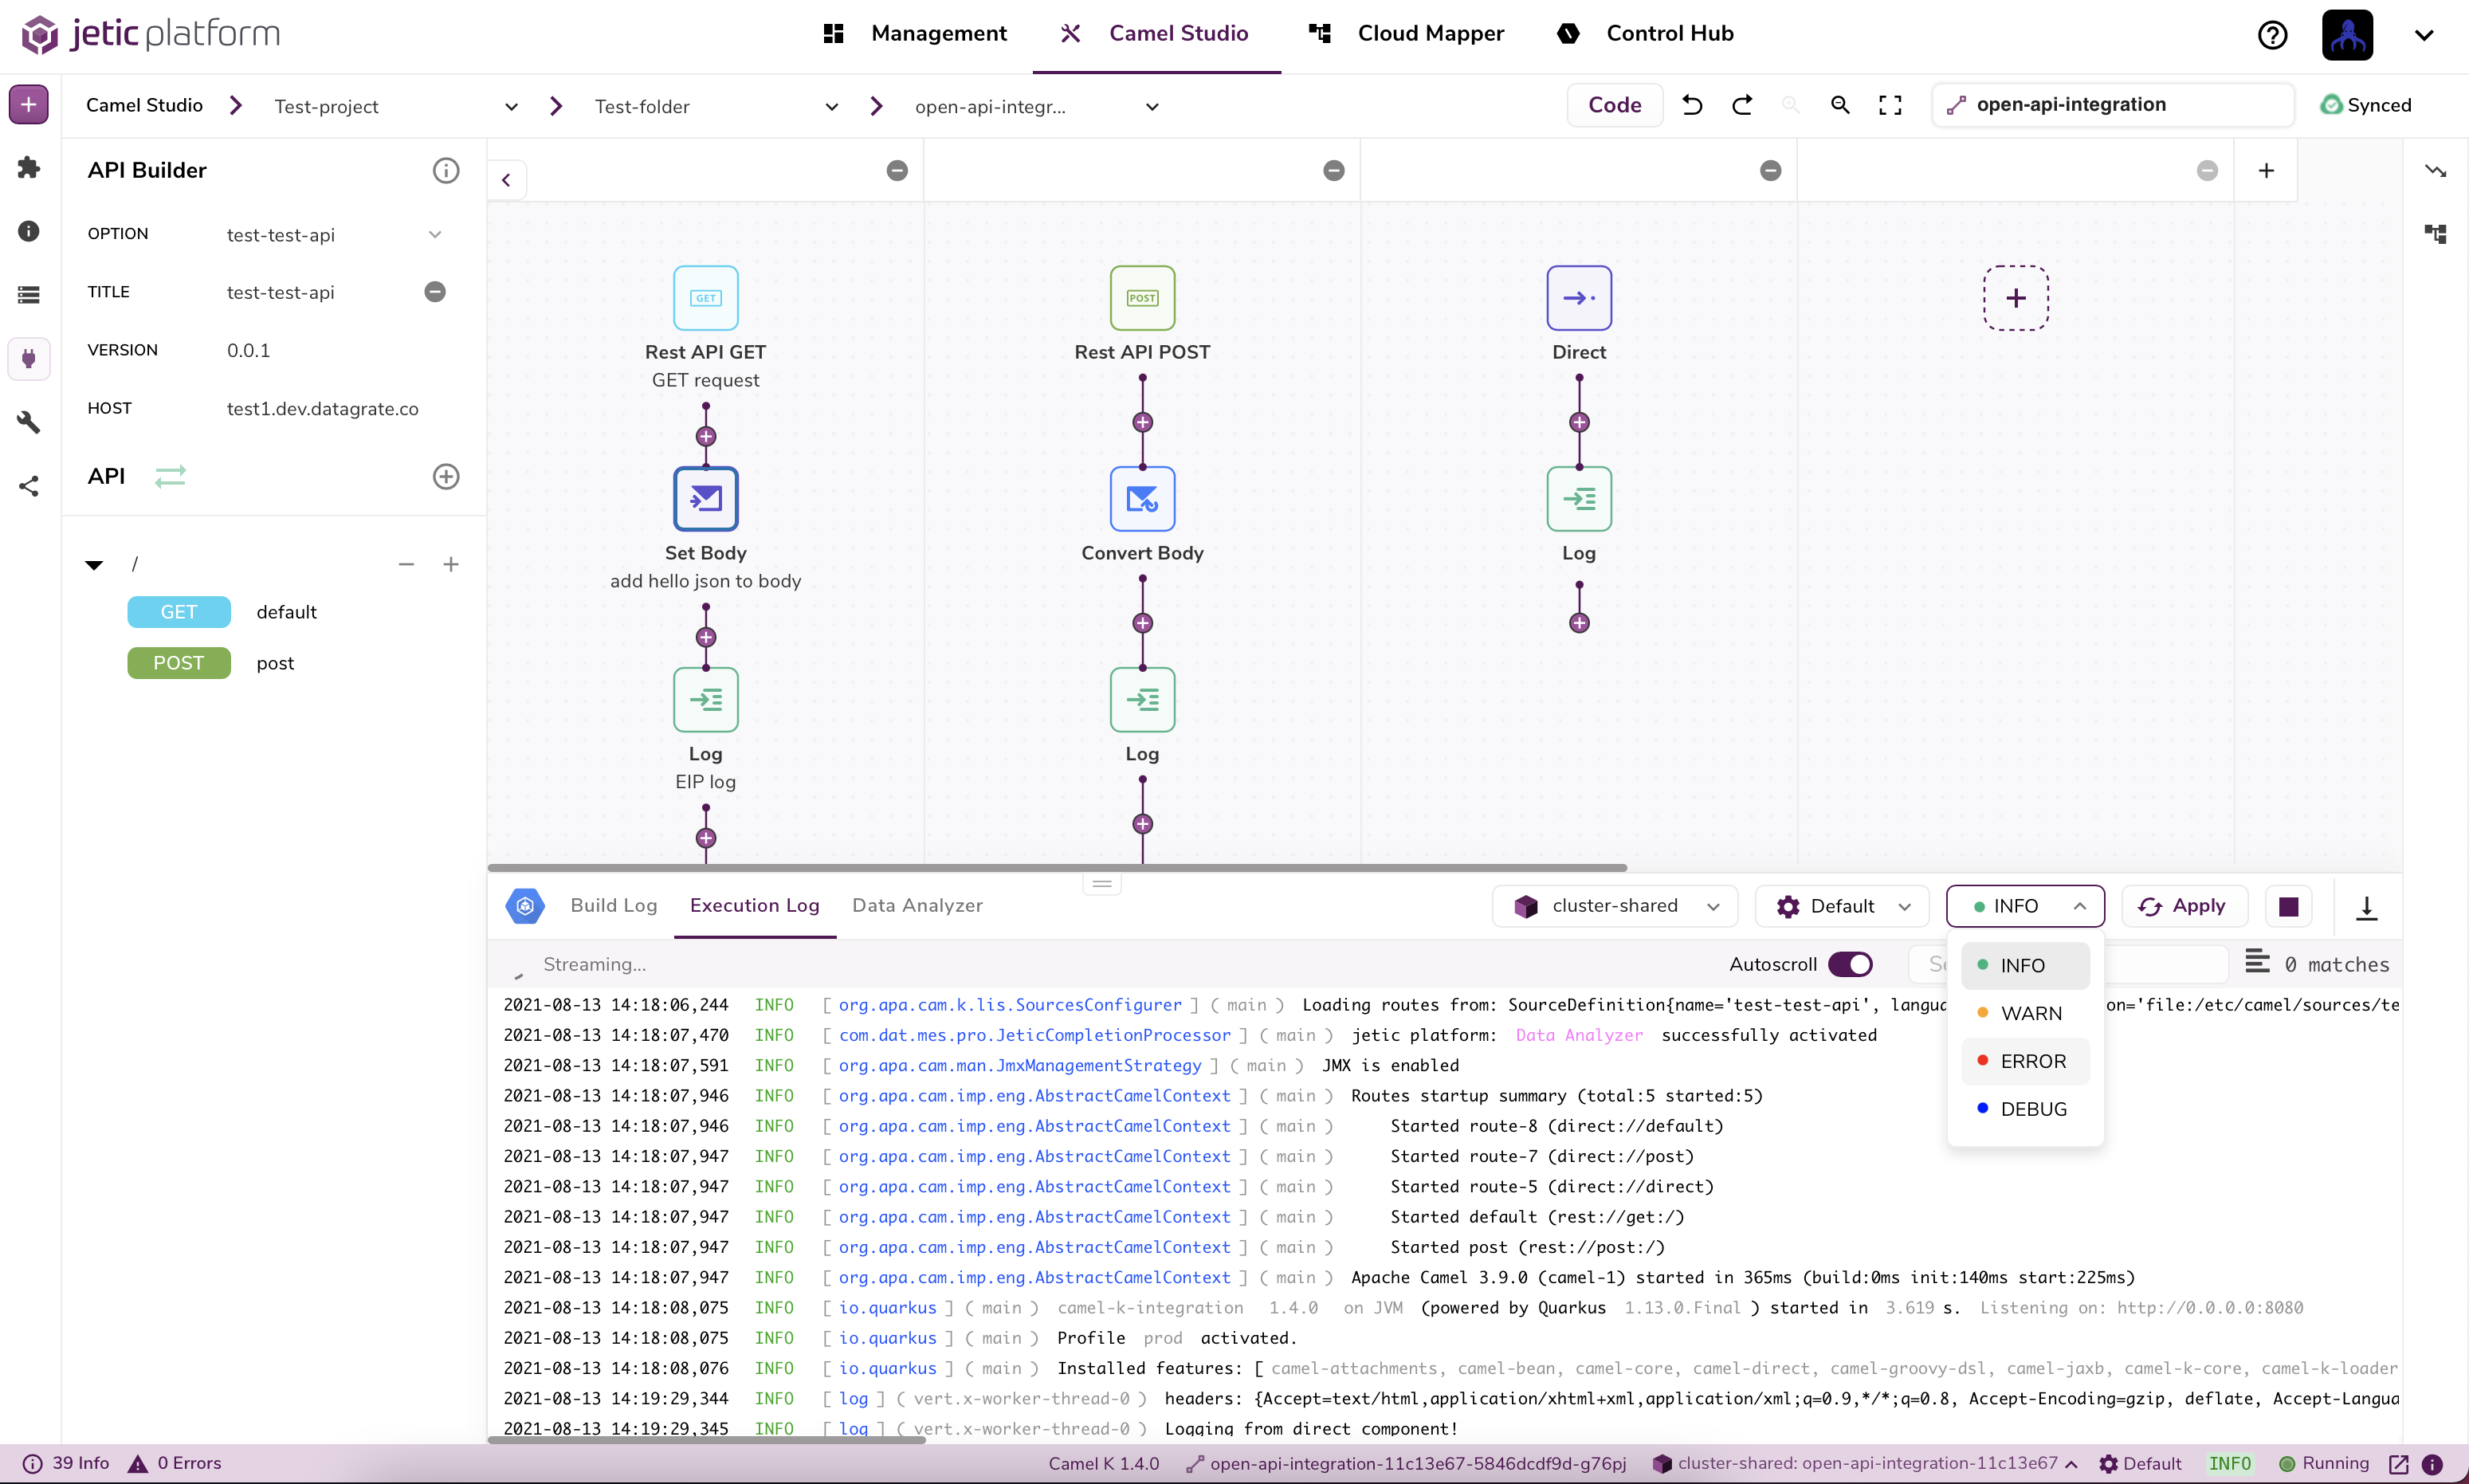
With the Deployment Manager you can control how integrations get deployed by selecting from multiple dropdowns to configure:
- Cluster: The Kubernetes cluster you want your integration to be deployed to.
note
Only successfully connected clusters will display in the cluster dropdown
Parameter Profile: By default it is set to 'Default'
Log Level: The default level is 'INFO'
Once you have your congifurations selected simply click the start button on the right and wait for your integration to build and deploy. You should notice that the 'start' button changes to 'Apply'. This is because you can update an integration that's already deployed when you've updated either the integraion itself or any configurations. Camel-K makes updating integrations a very fast process and your integration may be re-deployed in just moments!
The square 'stop' button is also going to be enabled so you can un-deploy your integrations.
tip
Try to keep in mind that an integration may be running and you just don't see it because your deployment manager may be selected to a different cluster. This is because the Deployent Manager only shows information for integrations deployed in the selected cluster.
Log Viewer#
There are 2 types of logs we expose from your deployed integrations:
- Build logs: Streamed logs from your cluster as Camel-K builds your integrations pods.
- Execution Logs: Logs that stream directly from your integration after it's deployed and running.
important
To view execution logs you'll need to add 'Log' components in your integration. Without them the only logs you'll see are exceptions, dependent on your log level of course.
Data Analyzer#
While an integration is currently you have access to the data analyzer tab which will let you view the Camel Exchanges that pass through your integrations.
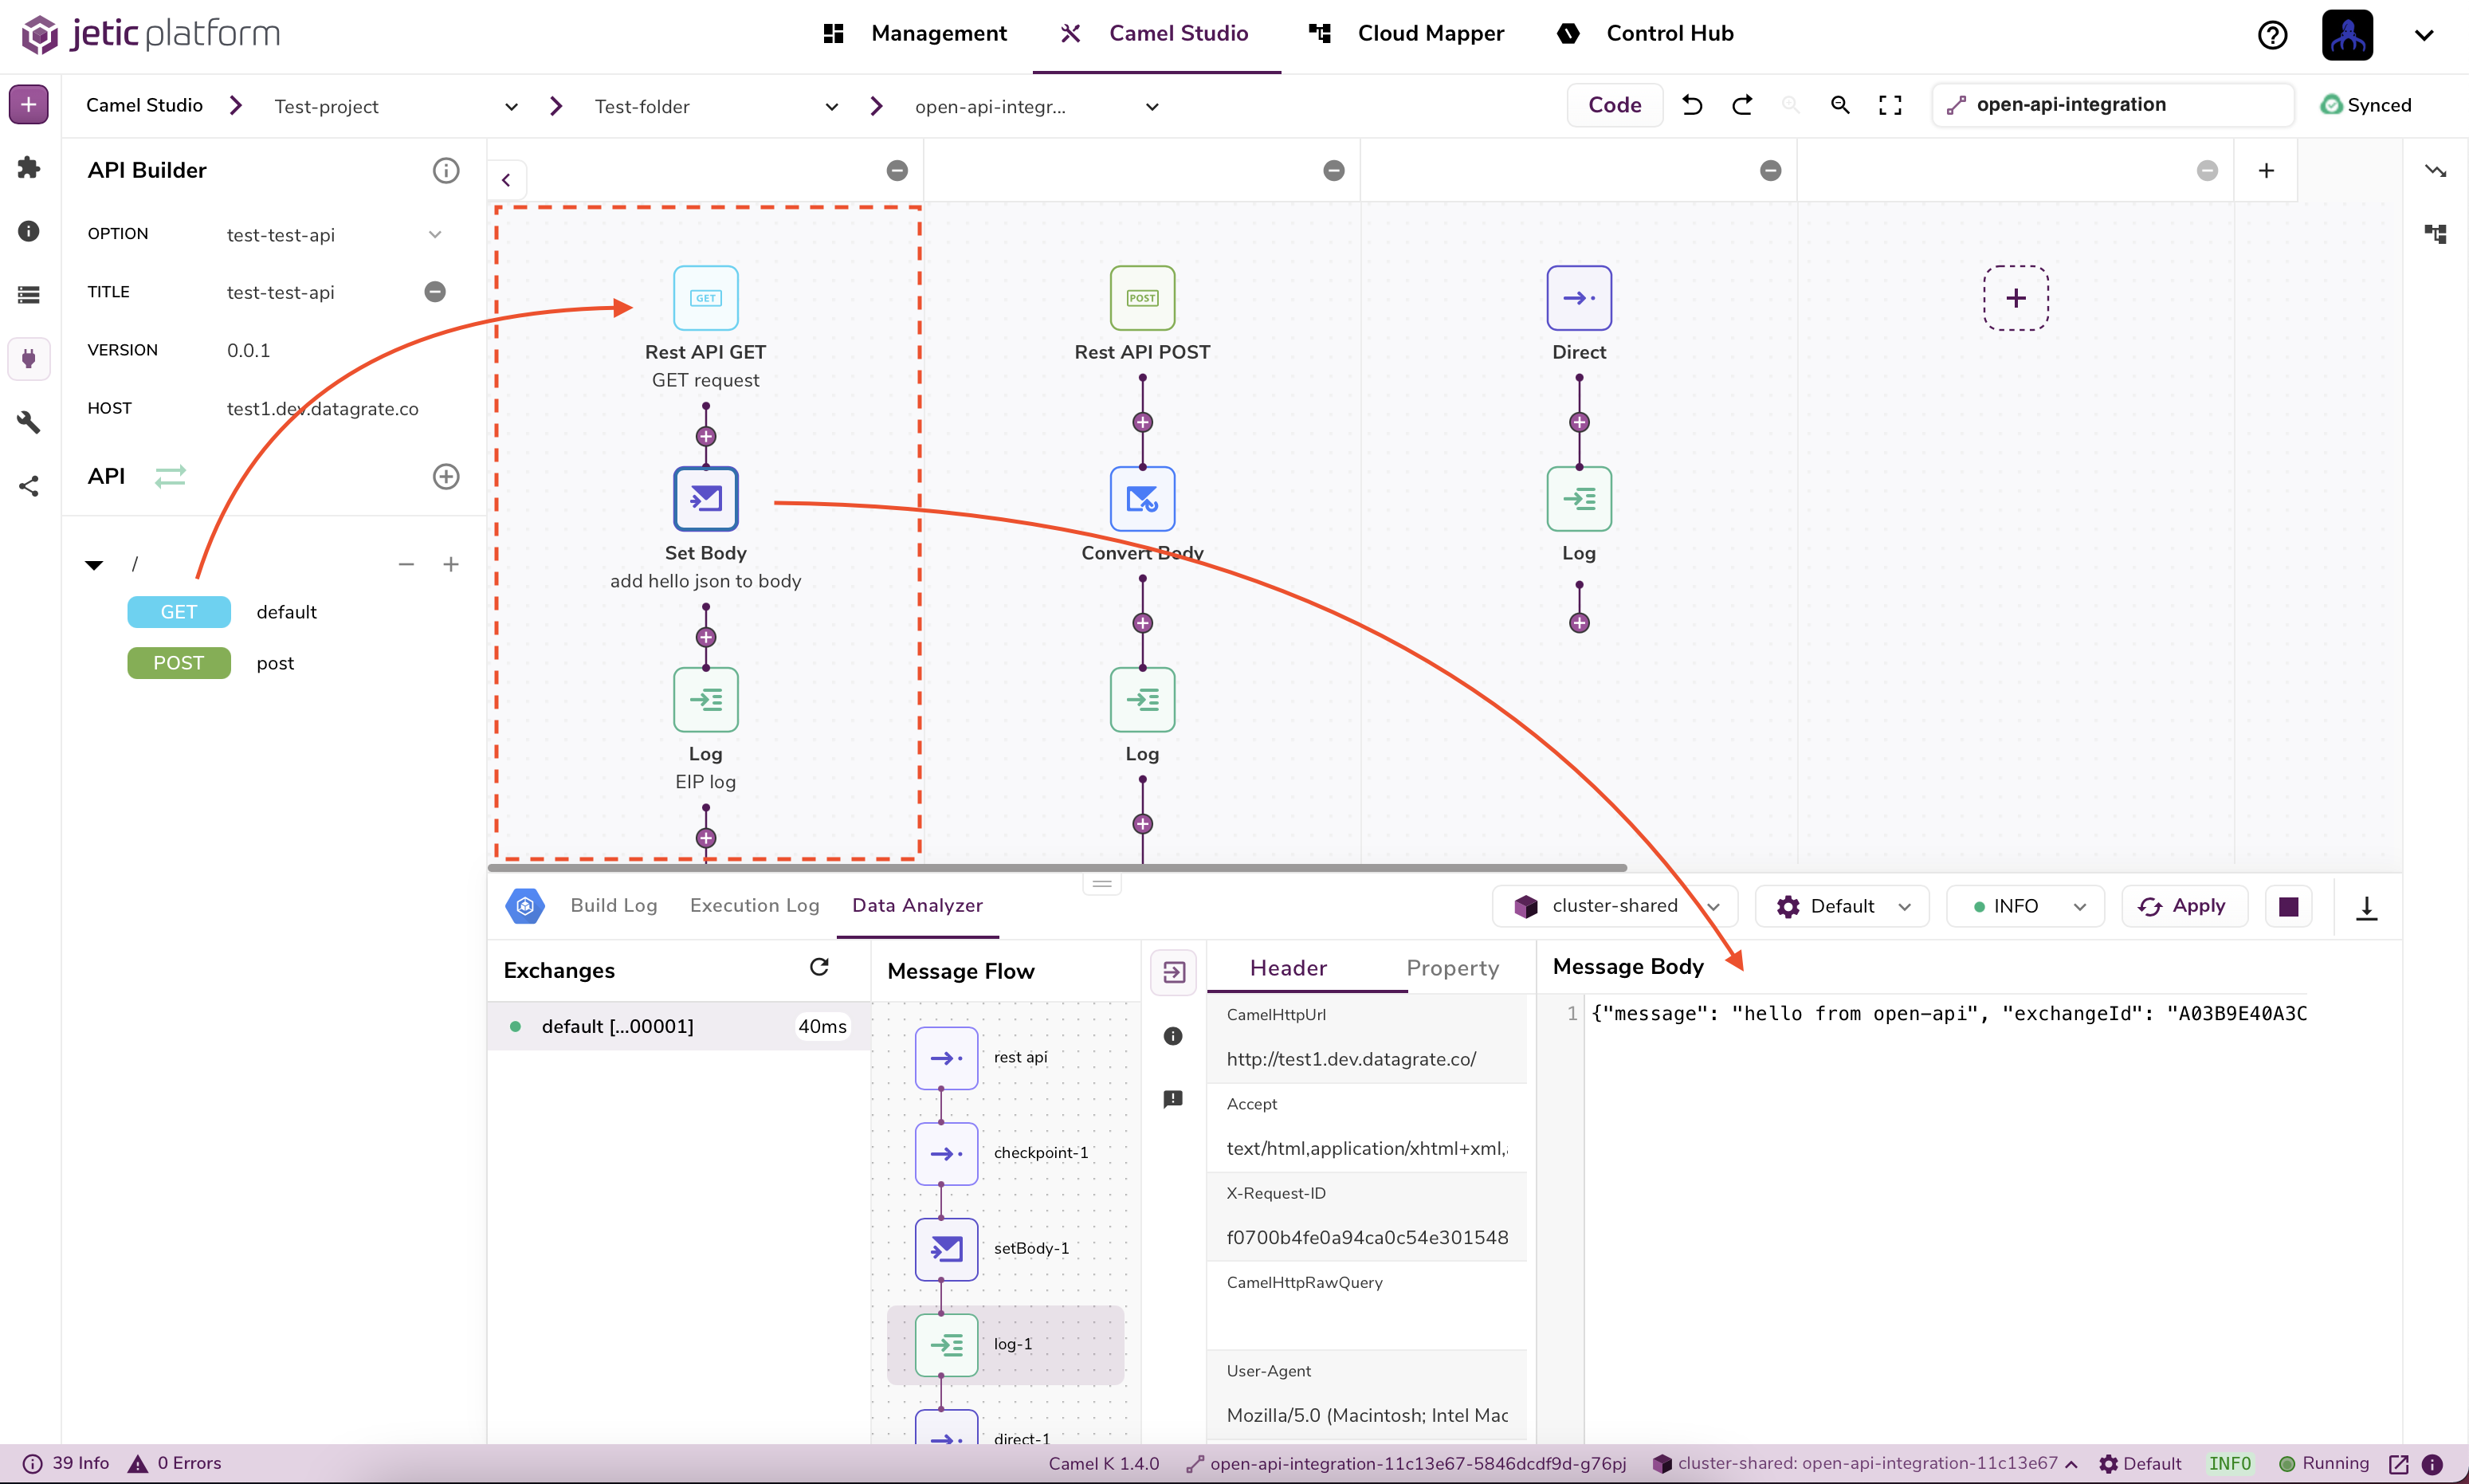
In the example above you can see what it looks like when an OpenApi GET endpoint receives a request.
The exchanges will accumulate in the left hand side of the Data Analyzer and if you click on one you're able to see it's Message Flow. This is a record of every component the exchanged passed through in your route, as well as the data the exchange had after leaving each component.
You can see the exchange's:
- Headers
- Exchange Properties
- Message Body
- Exchange ID
- Route IDs passed through, and more!
If an excange encounters an exception in the route you'll see an indicator in the 'Exception' tab of the Message Flow, along with a description of the exception itself.
tip
Exceptions are also viewable in the 'Execution' tab of the Log Viewer depending on your deployed Log Level