Control Hub
The Control Hub provides a high level view of your clusters and the integrations deployed within them. We'll discuss each part of the Control Hub along with the features available for you.
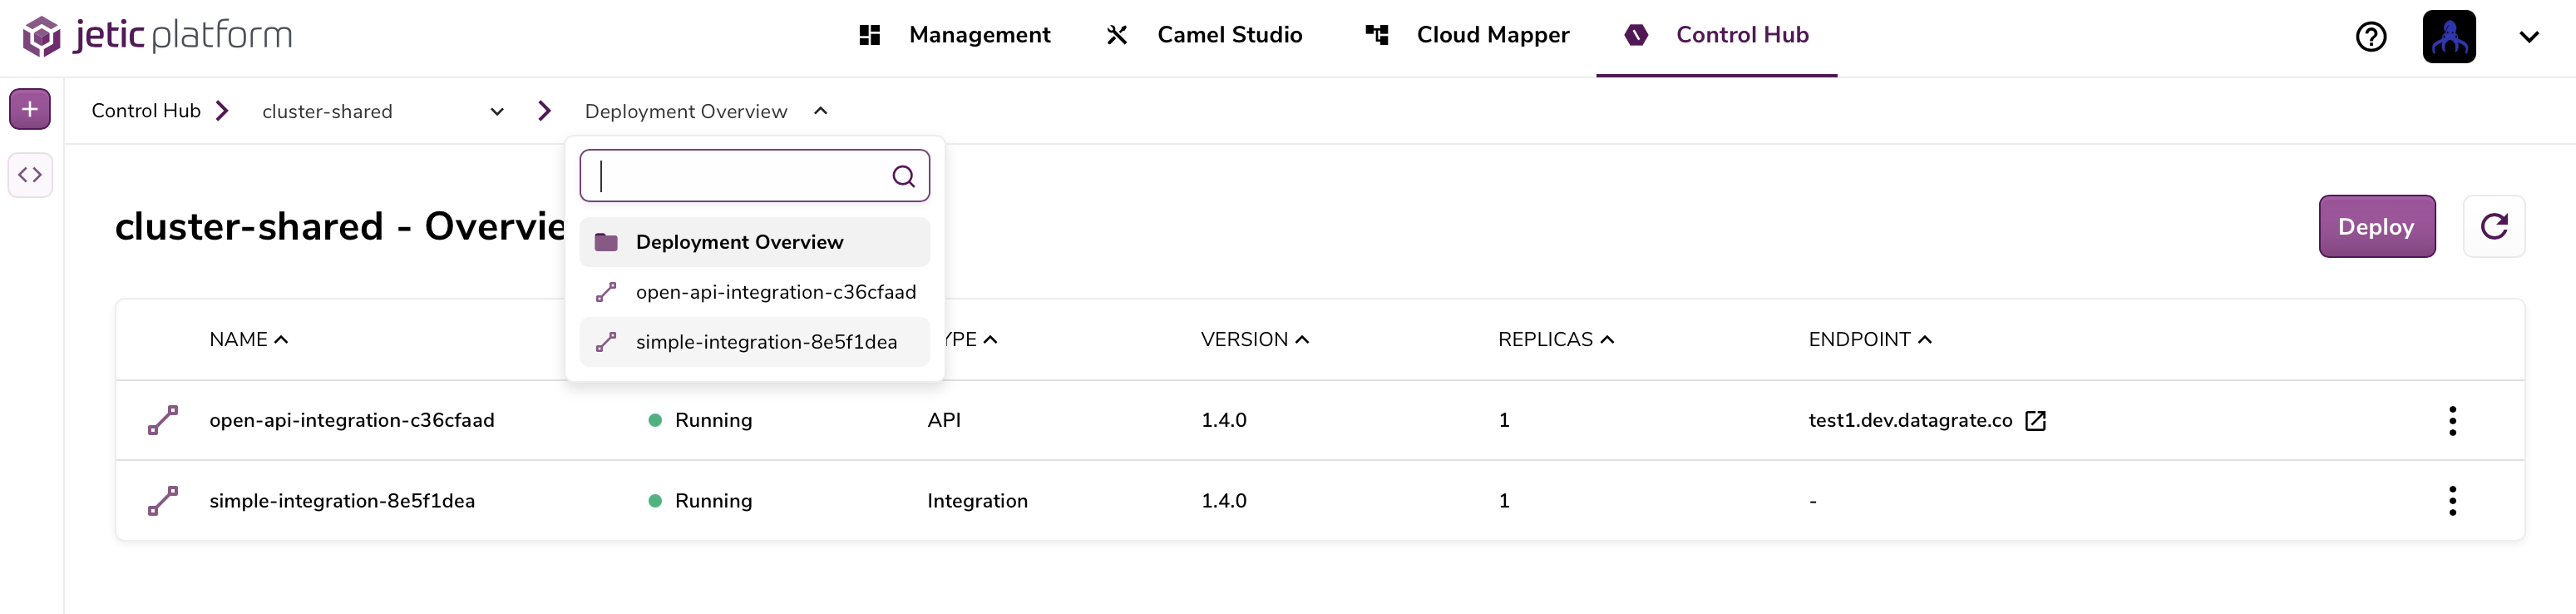
When you first navigate to the Control hub you can select a cluster in the breadcrumb dropdowns.
Only successfully connected clusters will appear in the cluster dropdown
When a cluster is selected you'll automatically see its "Deployment Overview"
Deployment Overview#
The Deployment Overview displays a list of integrations that are currently deployed in the cluster. Each integration in the list will display some high level information about the state of the deployment. This includes the deployment status, type, and API endpoint for integrations that expose an API.
note
If you have an integration that was recently deployed, for example from the Camel Studio, you may need to refresh with the 'Refresh' button in the top right
You can also deploy an integration directly from the control hub with the 'Deploy' button located in the top right. This will open a modal where you can:
- Select your project
- Select your integration
- Configure any integration parameters
important
Adding integration parameters during Control Hub deployment will override existing paramters in the integration
You can get much more information regarding your deployed integrations by either clicking the integration row directly or use the breadcrumb dropdown.
Once an integration is selected you'll be navigated to the "Integration Deployment View"
Integration Deployment View#
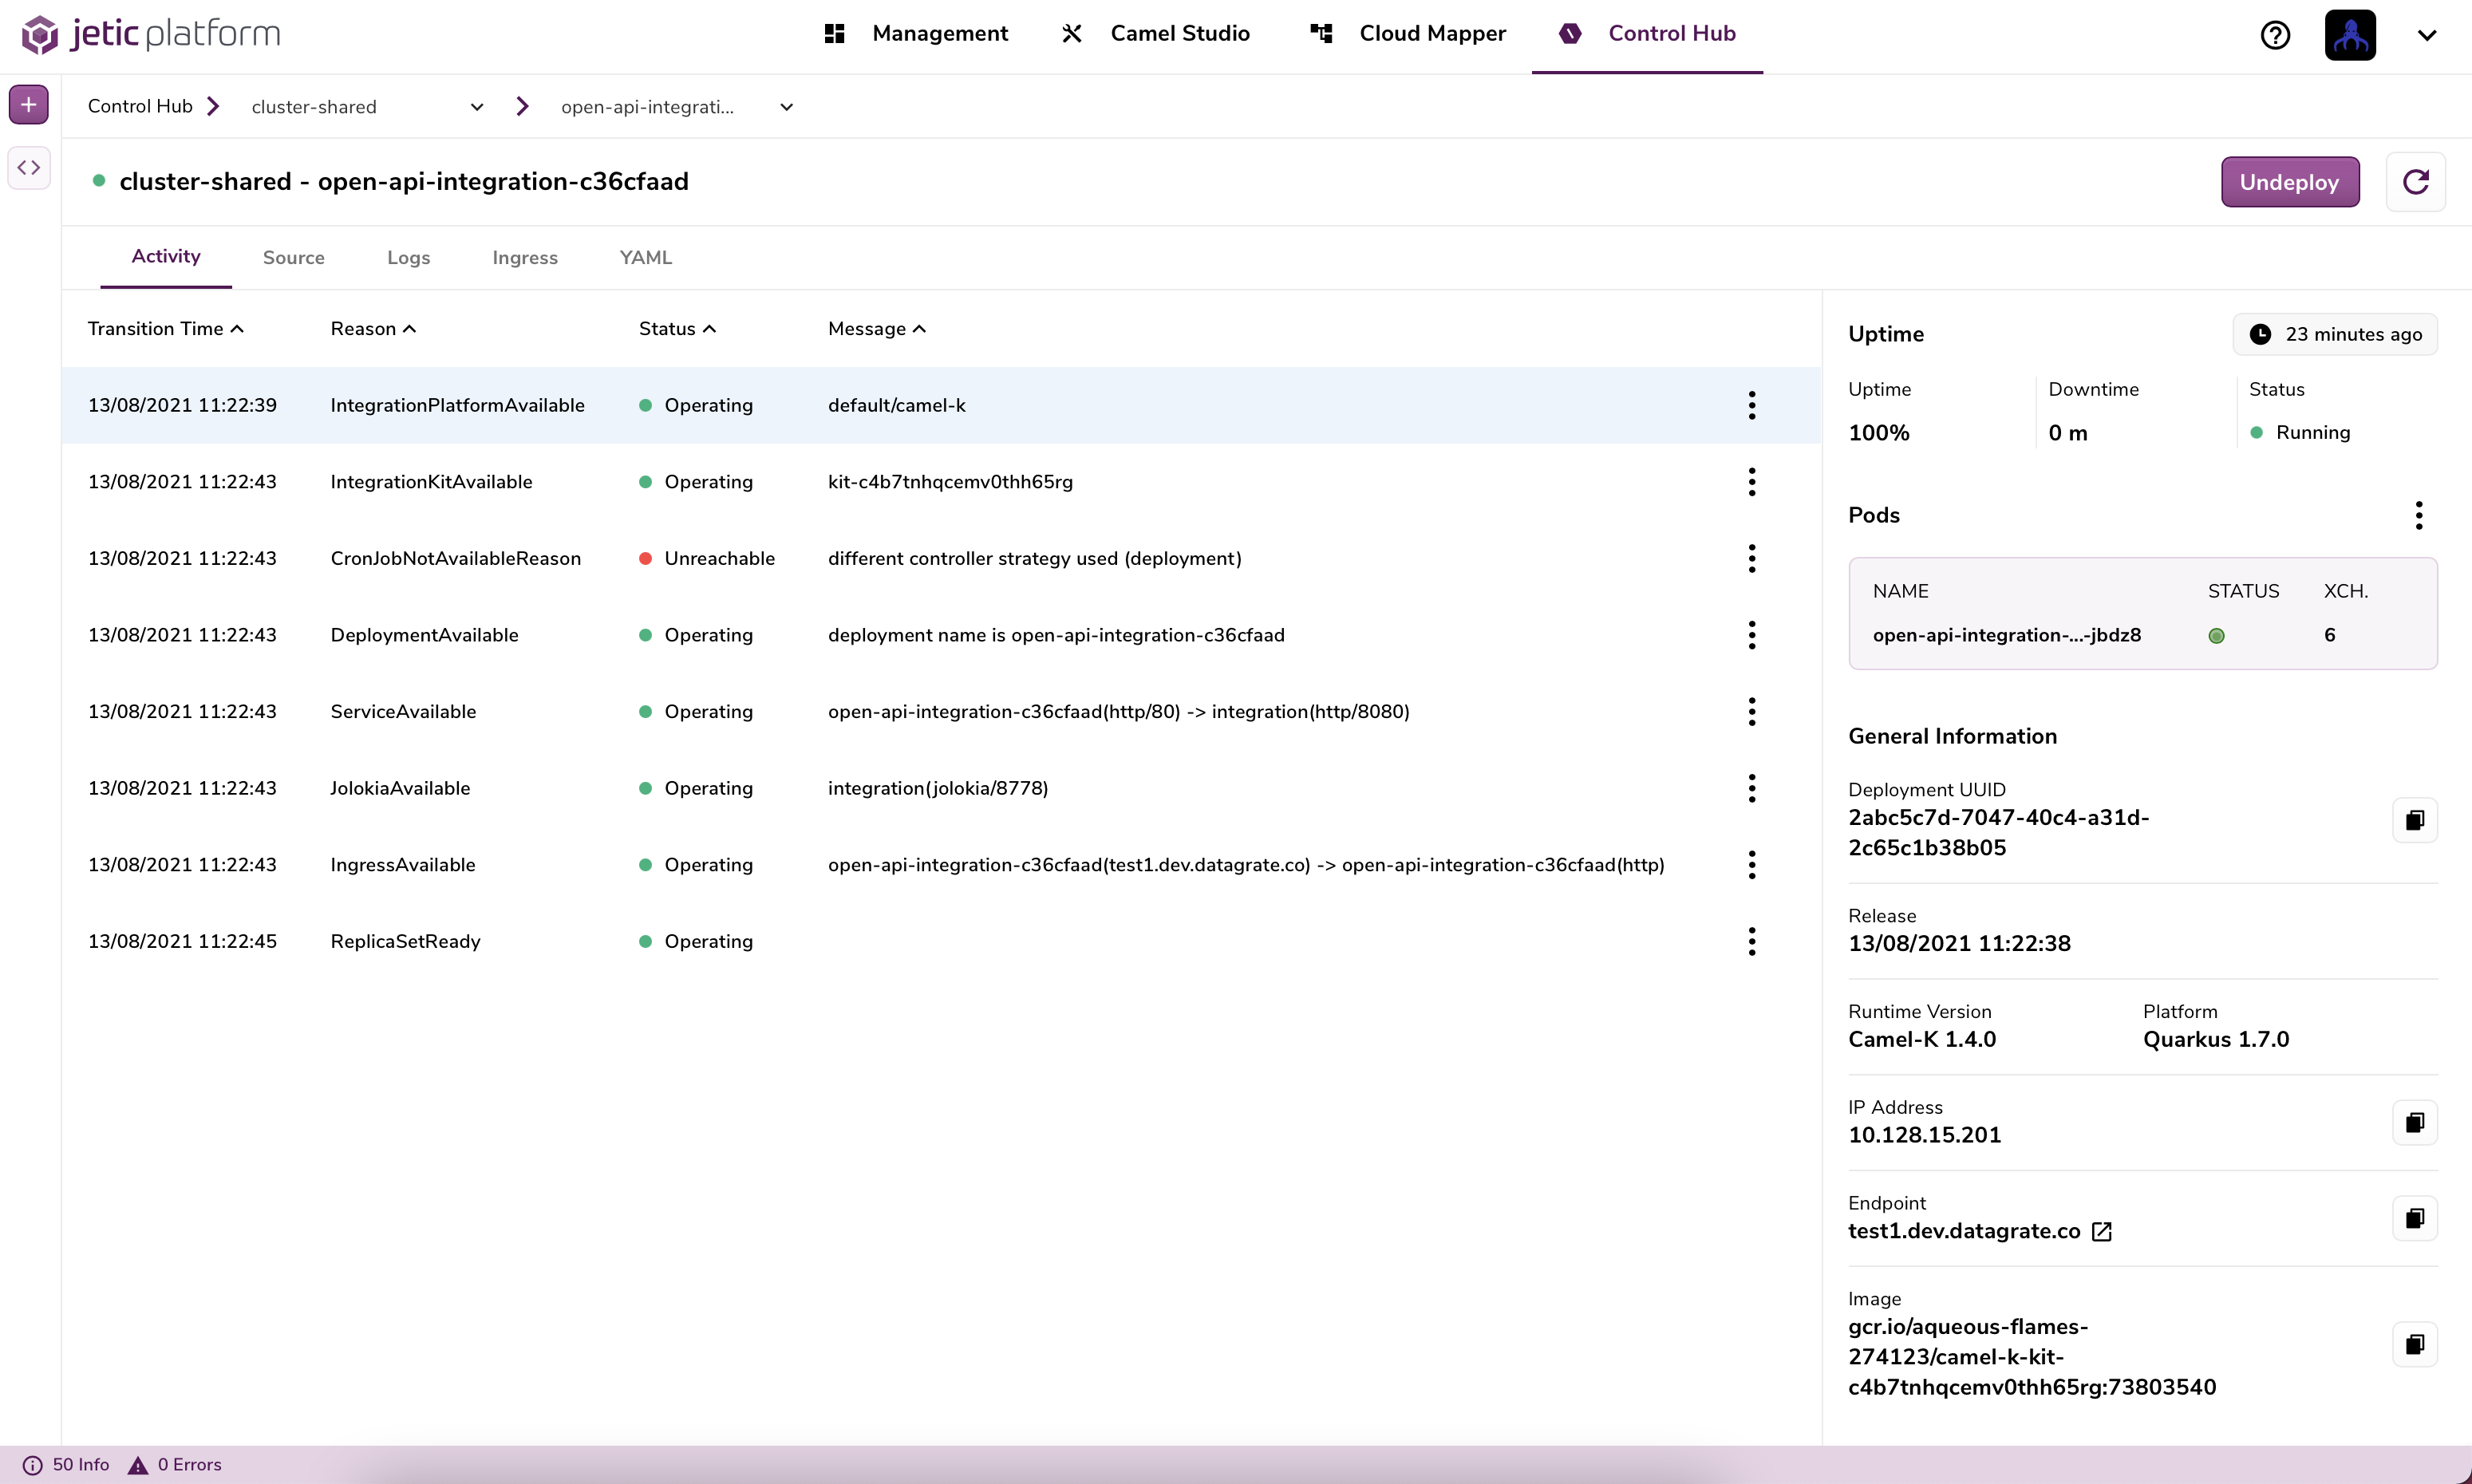
The Integration Deployment View contains virtually all the information available regarding how your integration is deployed in your cluster. It is split into 2 sections, a tab bar and a side panel.
Tab Bar#
The tab bar contains the following sections:
Activity#
Once deployed your integrations will go through many stages within Kubernetes and many resources will be created on your behalf. You can see some of this activity in this tab, for example, if a service has been established for your integration and if so at what time.
Source#
You can view the source code that was generated for your integration and currently running in your cluster.
tip
This source code can also be viewed from the Camel Studio by clicking the 'Code' button when you have an integration selected
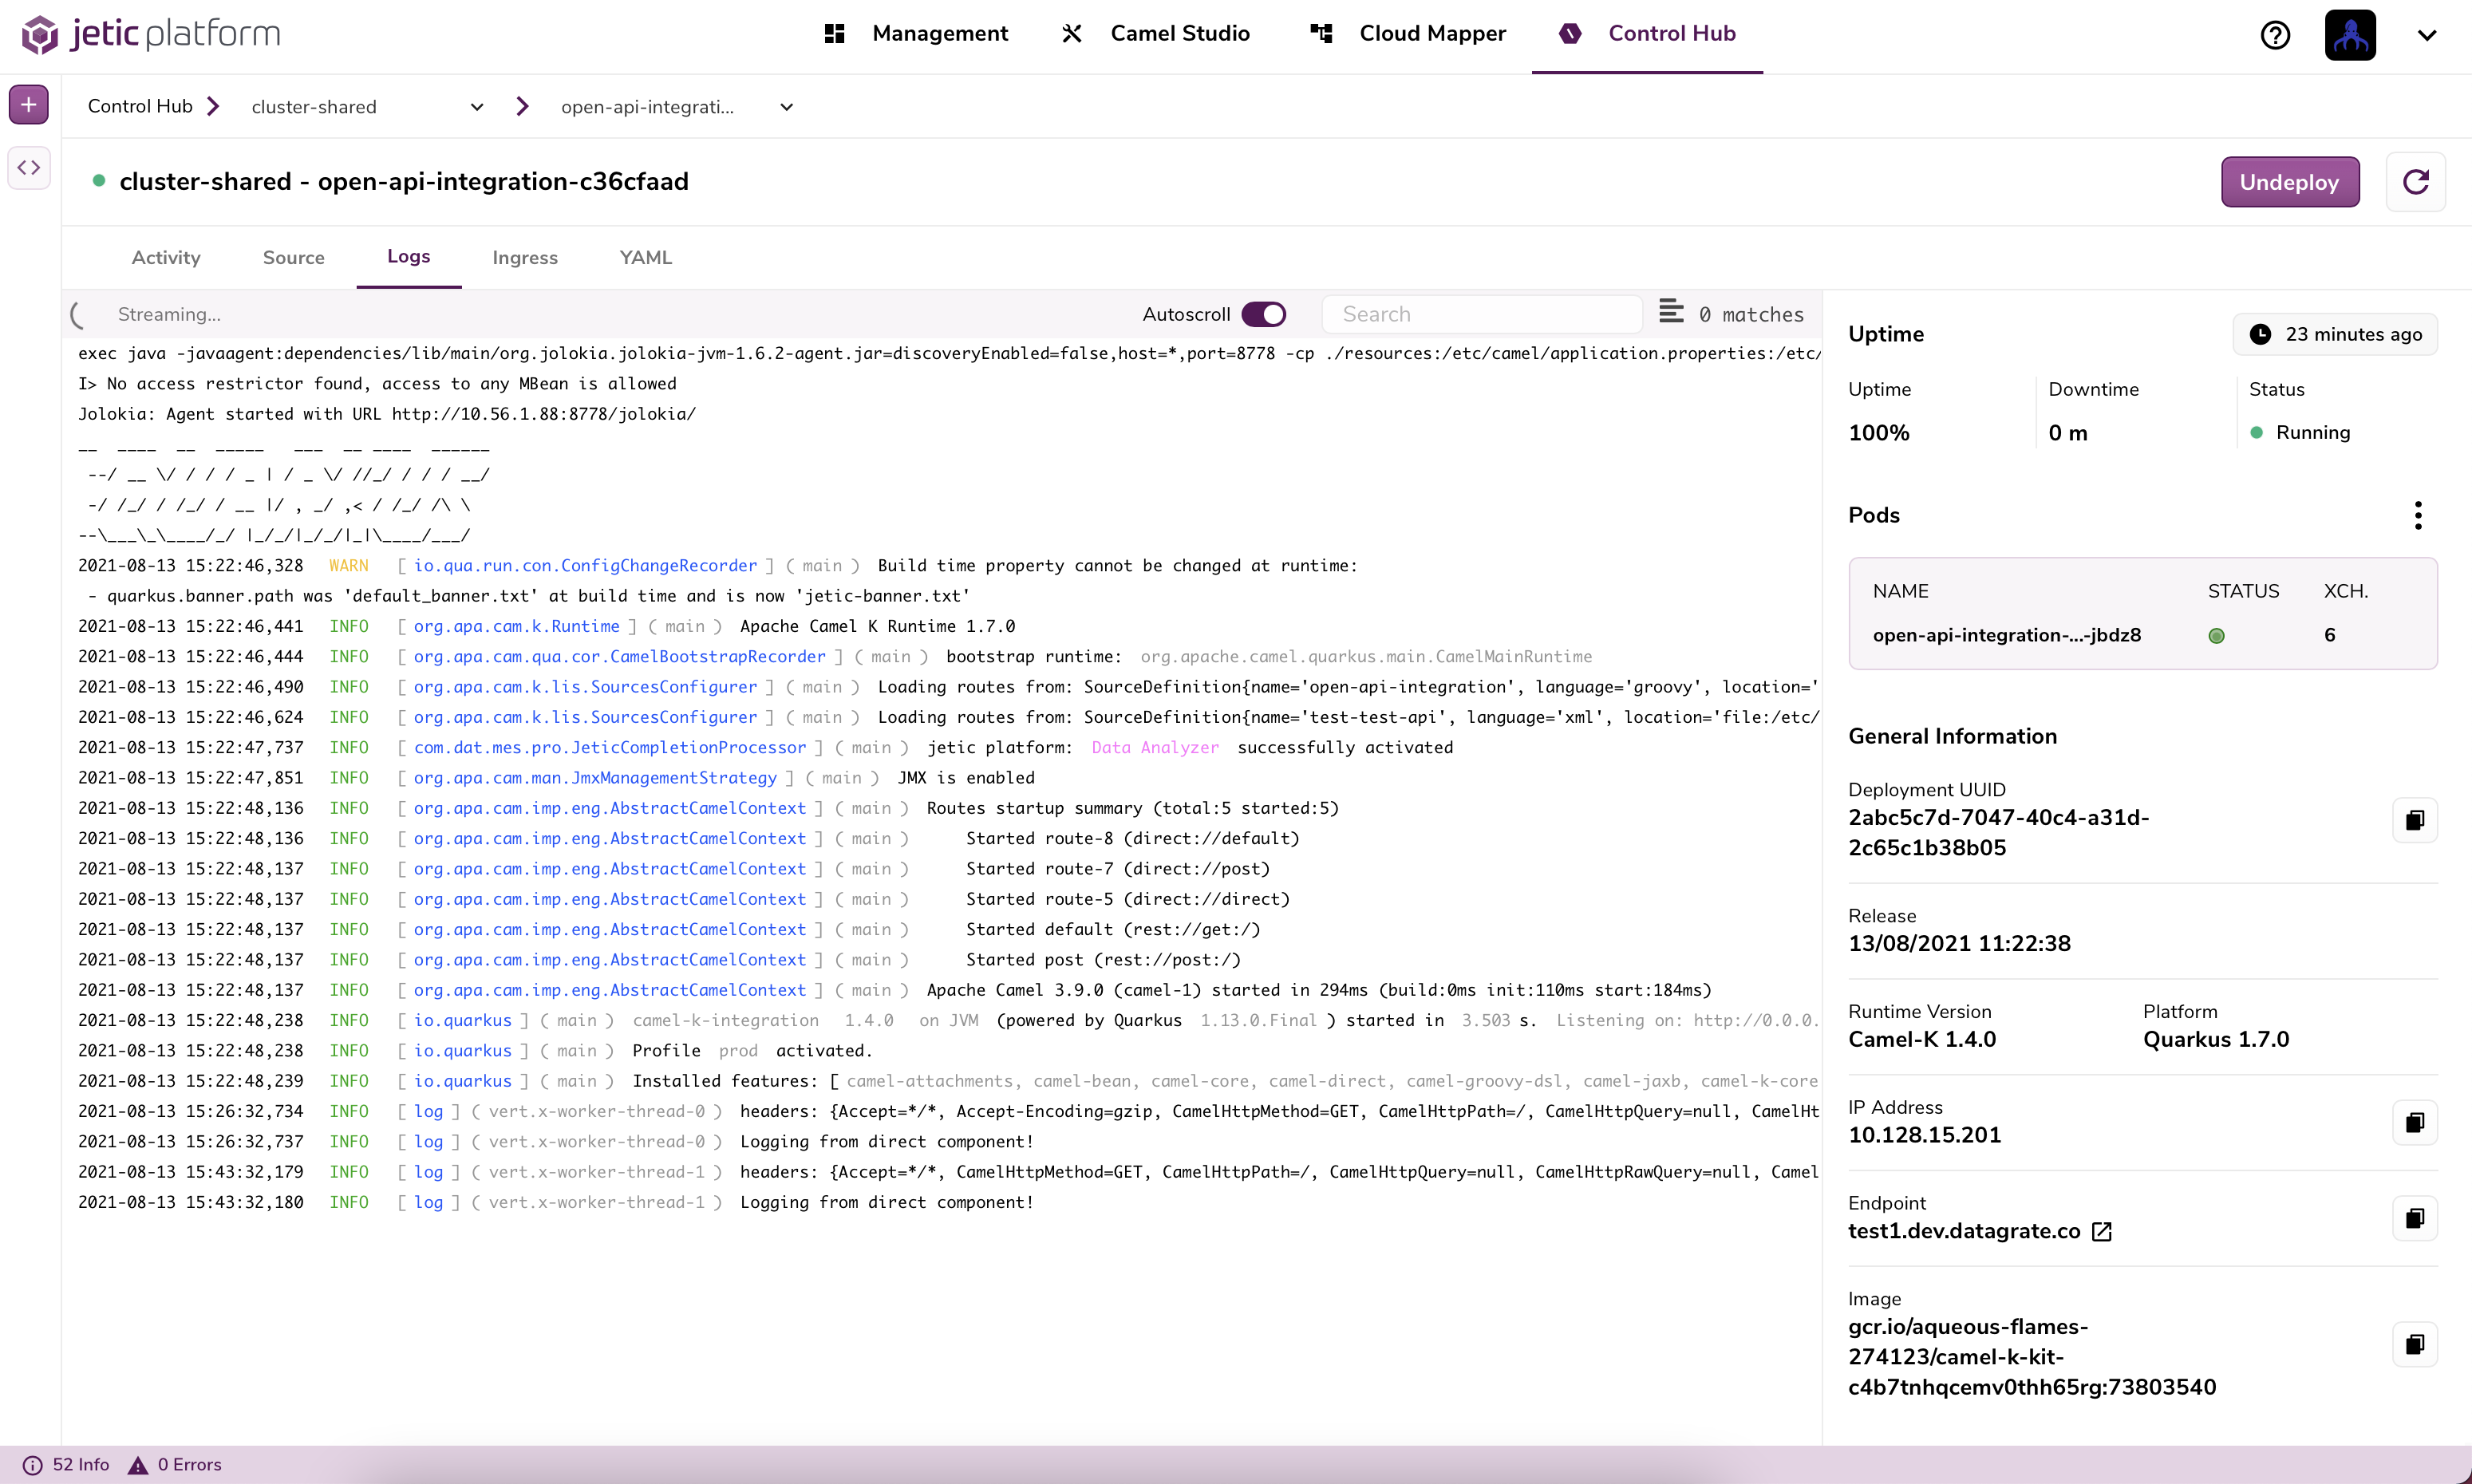
Log Viewer#
You can view execution logs from your integration in real time as they stream directly from your cluster.
tip
You can view these logs in the Camel Studio's Deployment Manager tab. Simply ensure the Deployment Manager's cluster dropdown is the same cluster your integration is deployed in and you should see the logs streaming in the 'Execution Logs' tab
Ingress#
If your integration is exposing an API it will have a corresponding Kubernetes Ingress resource. In this tab you can view the YAML for this Ingress resource.
Deployment YAML#
The 'YAML' tab will show you the YAML generated for your integrations deployment. You'll notice that within this YAML you'll find a lot of the other information available in the Integration Deployment View. For example you can find the source code for your integration as well as any additional resources in this deployment YAML.
Undeploy Integration#
You can undeploy an integration directly from the Integration Deployment View. Simply click the 'Undeploy' button in the top right and confirm your decision and a request will be sent out and you should notice your integrations status & other information update accordingly.
Side Panel#
This Side Panel is visible at all times while in the Integration Deployment View and contains more generic information about your integration. You'll find information similar to what's found in the clusters Deployment Overview:
- Uptime
- Health status
- UUID
- Pod name
- Endpoint (if exposing an API)
- Camel-K versions
- And more