Jetic Management
The main Management dashboard of the Jetic Platform provides a high level snapshot of your activity. We'll discuss each part of the it along with all of the other more detailed dashboards available to you. There's a lot to cover so let's get started.
Main Dashboard#
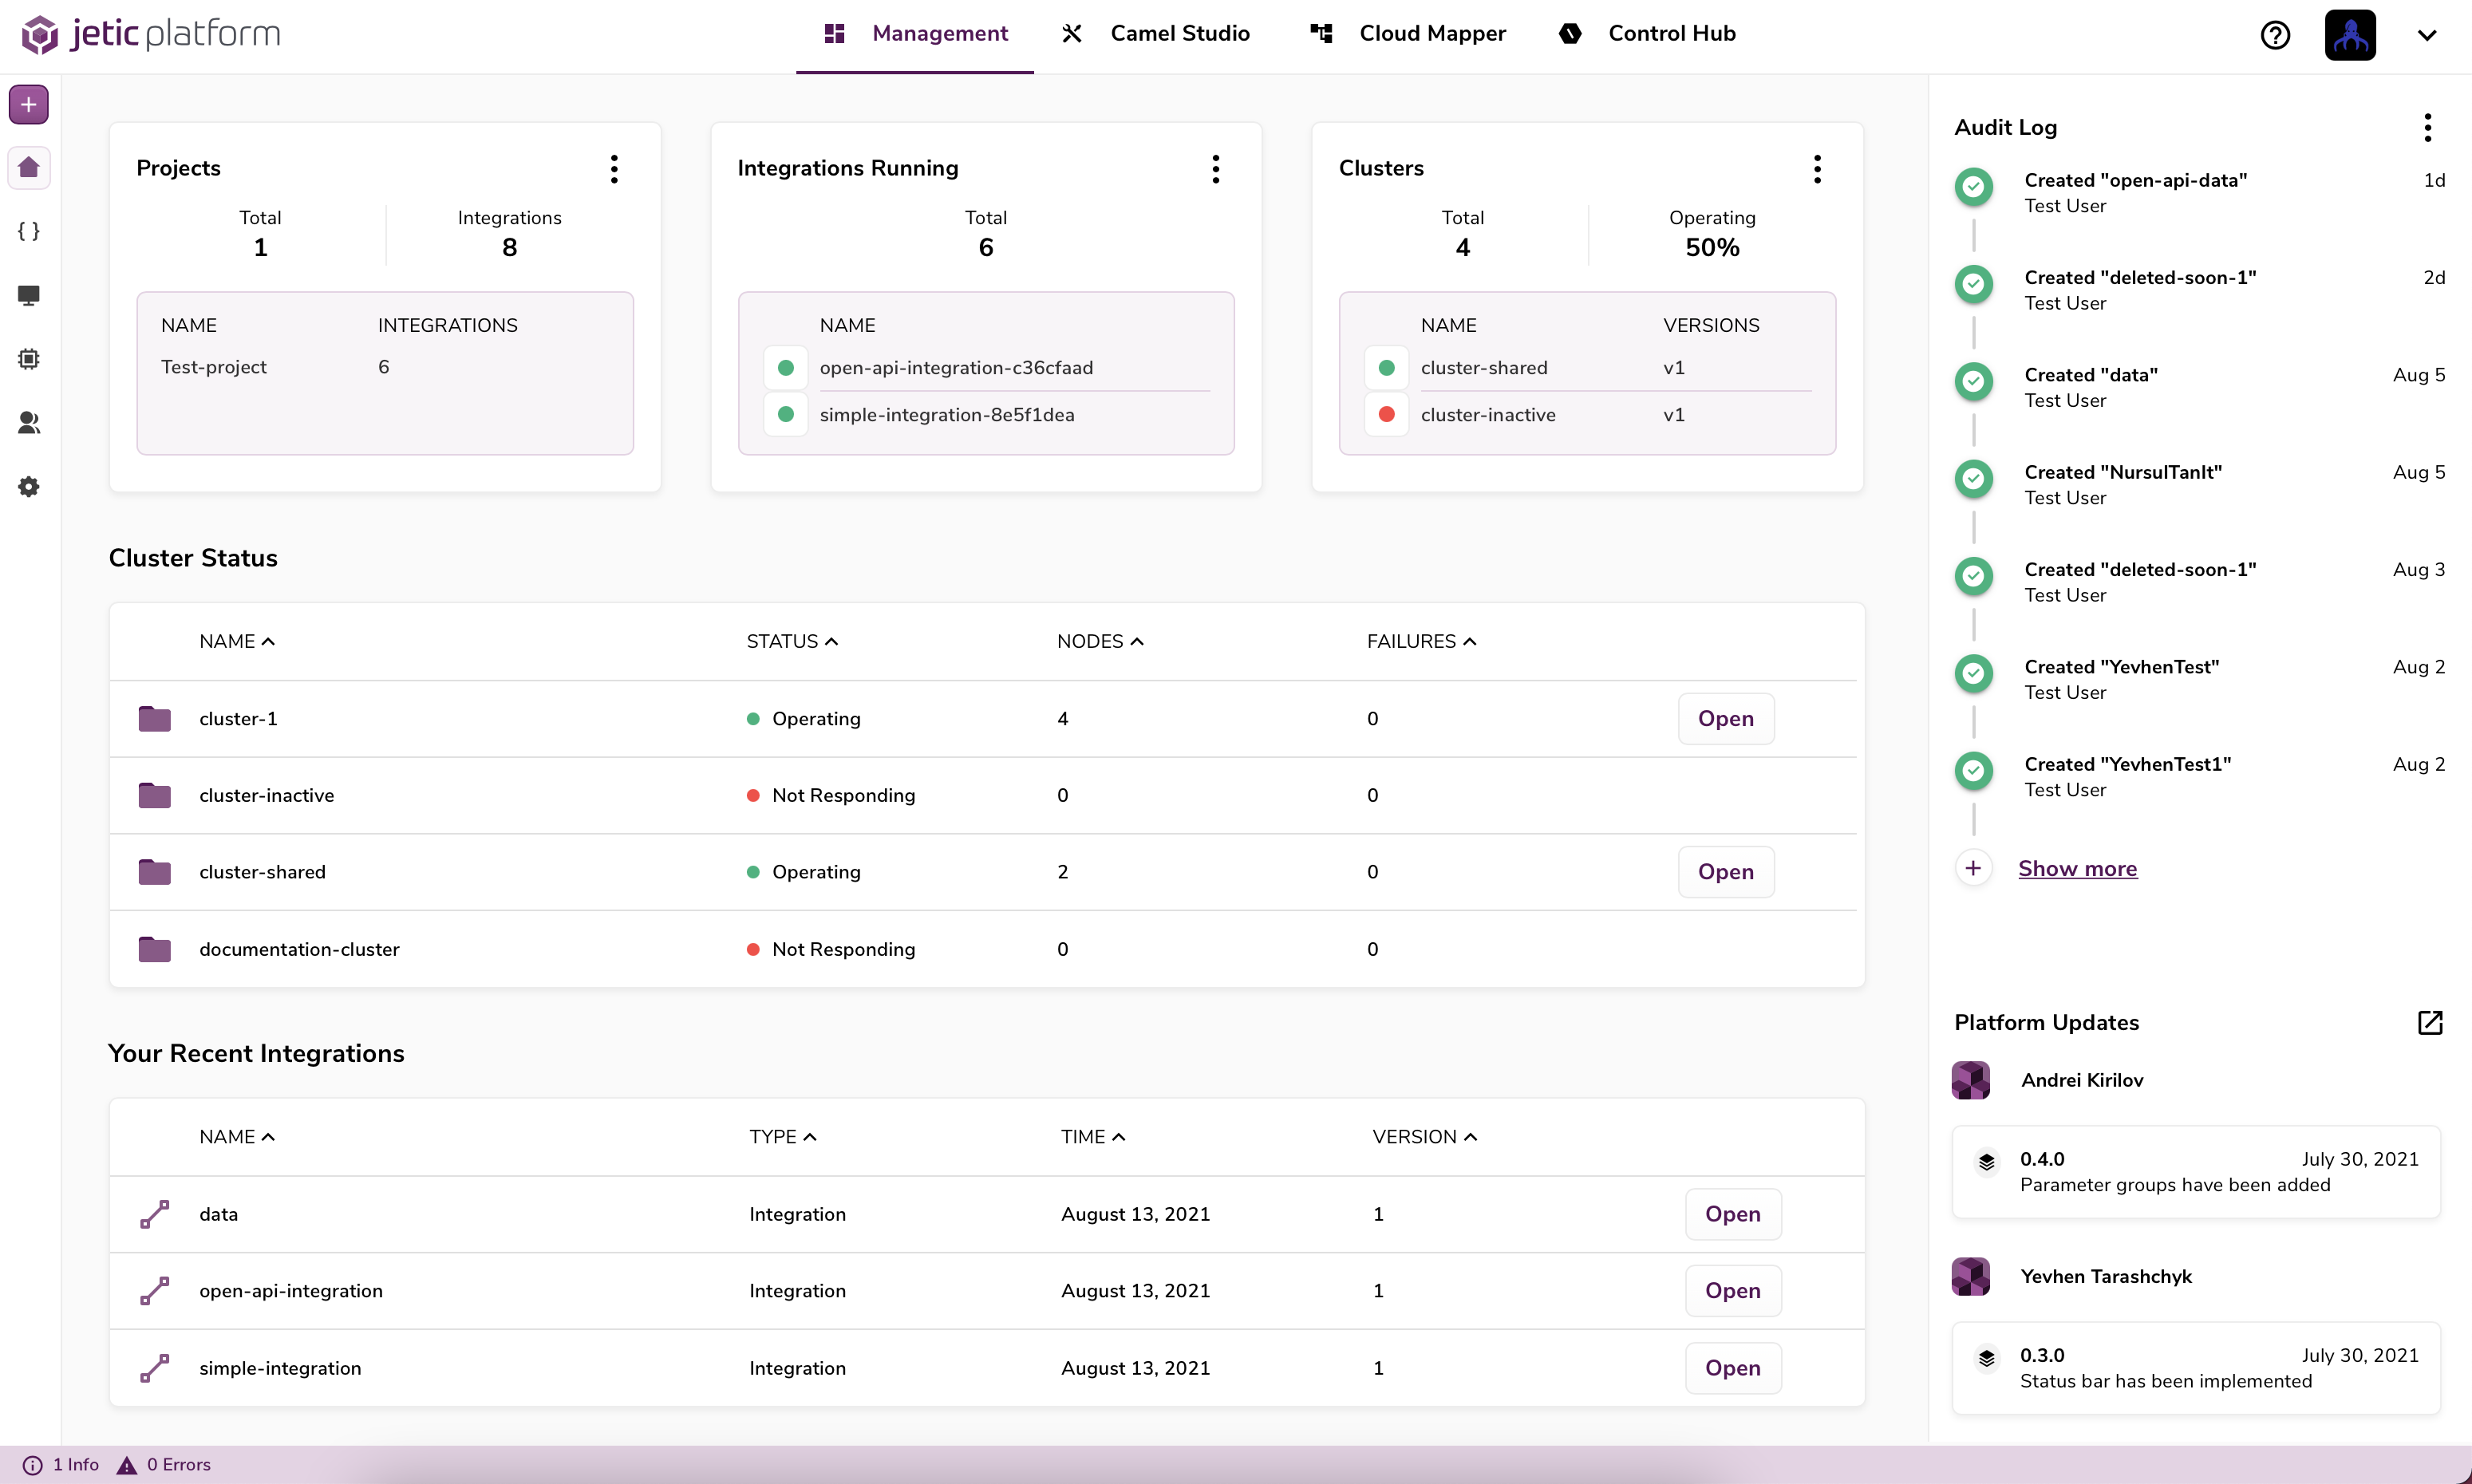
Displayed at the top of the main dashboard are 3 cards and you can select any of them to navigate to a more detailed view. Below the 3 cards you'll find 2 tables with information supplementary to the 'Integrations Running' and ' Clusters' cards. There is also a side panel that contains a log of your activity as well as updates to our application itself.
Projects#
The Projects card displays how many Projects you have as well as how many integrations belong to each Project. A Project is simply a logical object used for organizing your integrations.
At the top of the card you'll see the total number of Projects you have and the total number of integrations across all Projects. Navigate to the 'Projects Management' dashboard by selecting the card or by selecting the 'Projects' icon in the left side bar of the main dashboard
Integrations Running#
View how many of your integrations are actively deployed across all of your clusters. A preview of some of the deployed integrations will display in this card along with a green/red indicator corresponding to a running integration or a failed deployment.
You can navigate to the 'Integrations Management' dashboard by selecting this card or by selecting the 'Integrations' icon in the left side bar.
Clusters#
This card shows how many Kubernetes clusters you've connected to our application, both active and inactive. You will be able to see how many are actively returning a healthy status check with the 'Operating' percentage.
A preview of some of the clusters is shown in the card along with a green/red indicator corresponding to if the cluster is reachable or not (healthy vs unhealthy). Navigate to the 'Cluster Management' dashboard by selecting this card or by selecting the 'Clusters' icon in the left side bar.
Cluster Status#
This table shows a bit more information about each cluster you've connected to our application. It also has some general info about your Kubernetes cluster. Within each row is also a 'Open' button to navigate to that clusters detailed overview page in the Control Hub
Your Recent Integrations#
This table shows some more information about the integrations that are running in your connected clusters. Each row also has a 'Open' button which navigates to that integration in the Camel Studio.
Side Panel#
Audit log#
A collection of actions performed by users within your tenant account
Platform Updates#
A record of version updates to our application.
Next we'll cover some of the more detailed dashboards available to you.
Detailed Dashboards#
There are many additional dashboards available in the left side panel of the main dashboard. These dashboards are specific to a certain resource within the application and contain more detailed information than is present in the main dashboard.
Integrations Management Dashboard#
- Projects Management Dashboard:
- A table view of all existing projects within the tentant account
- These projects can be edited and deleted but keep in mind that deleting a project will delete all integrations within the project.
- You can also create a new project from this dashboard with the 'Add Project' button in the top right which opens a modal
- Cluster Management Dashboard:
- A table view of all existing clusters associated with the tenant account
- Each cluster will have a '3-dot' option button which will allow you to:
- Update the container-registry settings of your cluster.
- Update the 'cluster configuration' which is general information like name, description, etc.
- You may also delete a cluster
- You can also create a new cluster object with the 'Add Cluster'. Note that this cluster object will still need to be connected to your actual cluster before continuing on with our application.
- User Management Dashboard:
- A table view of all users associated with the tenant account
- Each user will have a '3-dot' option button which will allow you to:
- Edit user information like:
- Name
- Role
- Delete user. Keep in mind that a deleted user can still be displayed within the application, for example as an owner of an integration
- Reset password. An email will be sent out to the associated email to update the password with Auth0
- Edit user information like:
- You may also invite a new user to your tenant account with the 'Invite User' button in the top right. This will send an email request to the provided email for registration with our application with Auth0
- Profile Settings Dashboard
Here you'll find the following tabs: